OPEN-SOURCE SCRIPT
Обновлено Bond Yeild Curve
Bond Yeild Curve
A bond yeild curve is a line that plot the interest rate of bonds of each maturity dates.
The slope of the curve give the future of economy cycle.
if the slope could be normal (positive), flat or even inverted.
This indicator aquired data of bond yeild provided by TradingView.
How to use it.
How we can get the benefit.
- If the current spread is greater than 1.0, it suppose that the economy of that country probably is ok.
- if the current spread is between 0 - 1.0, it suppose to be flatted and probably turn to invert and the economy cound be in a recession soon.
- if the current spread is below 0, it suppose to be inverted and economy is in recession.
when knowing the state of economy, it would help us to manage our investment.
When you select "Yeild"

When you select "Spread"

When you select "Yeild Curve"

I'm new for this.
if any idea, correction and suggestion, i do appreciate it.
A bond yeild curve is a line that plot the interest rate of bonds of each maturity dates.
The slope of the curve give the future of economy cycle.
if the slope could be normal (positive), flat or even inverted.
This indicator aquired data of bond yeild provided by TradingView.
How to use it.
- Select the country of the bond / another country to compare.
- Select the maturity of bond (this indicator set 2Y, 5Y, 10Y and 20Y as default).
- You can toggle to 3 different data set; Yeild, Spread (10Y-2Y) and Yeild Curve.
- In case that you select the "Yeild Curve", you can customize the desired past period to compare.
How we can get the benefit.
- If the current spread is greater than 1.0, it suppose that the economy of that country probably is ok.
- if the current spread is between 0 - 1.0, it suppose to be flatted and probably turn to invert and the economy cound be in a recession soon.
- if the current spread is below 0, it suppose to be inverted and economy is in recession.
when knowing the state of economy, it would help us to manage our investment.
When you select "Yeild"
When you select "Spread"
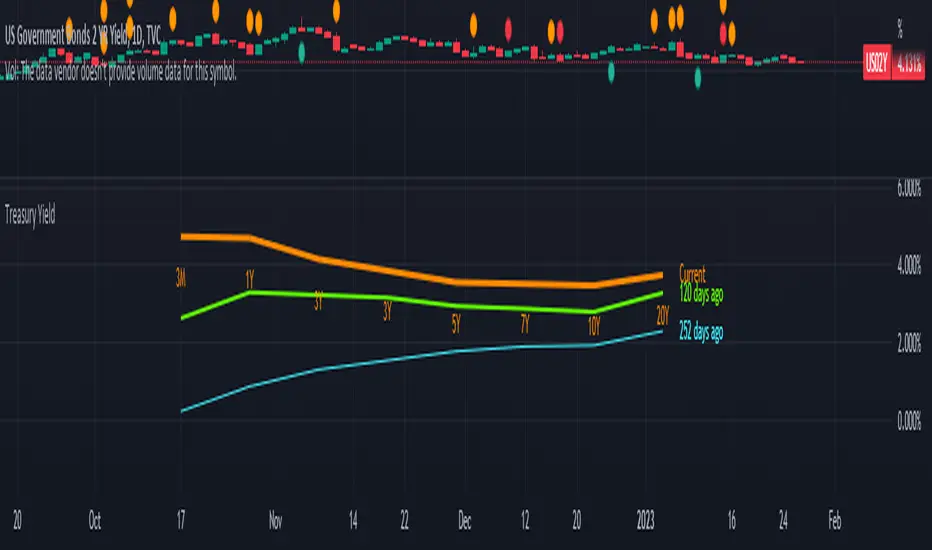
When you select "Yeild Curve"
I'm new for this.
if any idea, correction and suggestion, i do appreciate it.
Информация о релизе
Update. 1) Compare yield curve over period of time of treasury yield.
2) Compare yield curve between countries.
3) Show yield of each ttm in line chart.
Available TTM : 3M, 1Y, 2Y, 3Y, 5Y, 7Y, 10Y, 20Y
Some code i refer to this guy.
BarefootJoey :

Информация о релизе
Minor fixed.Информация о релизе
Update code and added 2-10 Spread. Скрипт с открытым кодом
В истинном духе TradingView, создатель этого скрипта сделал его открытым исходным кодом, чтобы трейдеры могли проверить и убедиться в его функциональности. Браво автору! Вы можете использовать его бесплатно, но помните, что перепубликация кода подчиняется нашим Правилам поведения.
Отказ от ответственности
Информация и публикации не предназначены для предоставления и не являются финансовыми, инвестиционными, торговыми или другими видами советов или рекомендаций, предоставленных или одобренных TradingView. Подробнее читайте в Условиях использования.
Скрипт с открытым кодом
В истинном духе TradingView, создатель этого скрипта сделал его открытым исходным кодом, чтобы трейдеры могли проверить и убедиться в его функциональности. Браво автору! Вы можете использовать его бесплатно, но помните, что перепубликация кода подчиняется нашим Правилам поведения.
Отказ от ответственности
Информация и публикации не предназначены для предоставления и не являются финансовыми, инвестиционными, торговыми или другими видами советов или рекомендаций, предоставленных или одобренных TradingView. Подробнее читайте в Условиях использования.