OPEN-SOURCE SCRIPT
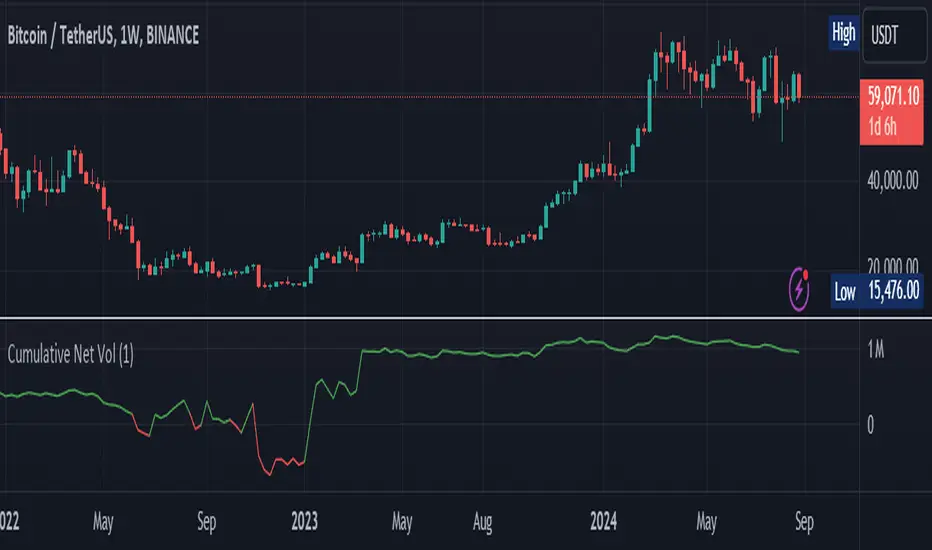
Cumulative Net Volume

Cumulative Calculation: Summarizes the net volume (buying minus selling volume) cumulatively, providing a running total that reflects the aggregate trading pressure.
Custom Timeframe Flexibility: Users can choose to analyze the volume on a custom timeframe, enhancing adaptability for various trading strategies.
Color-Coded Visualization: Features an intuitive color scheme where green indicates a net buying dominance and red signals net selling dominance, making it easier to interpret shifts in market dynamics.
Versatility: Suitable for all types of assets available on TradingView including cryptocurrencies like Bitcoin, stocks, forex, and more.
Utility: This tool is particularly useful for identifying trends in buying or selling pressure, which could be pivotal during significant market events or when assessing the potential for a trend reversal. By understanding the accumulation and distribution phases through the cumulative net volume, traders can make more informed decisions.
Perfect for both novice traders looking to get a grip on volume analysis and seasoned professionals seeking an edge in their trading tactics.
Скрипт с открытым кодом
В истинном духе TradingView, создатель этого скрипта сделал его открытым исходным кодом, чтобы трейдеры могли проверить и убедиться в его функциональности. Браво автору! Вы можете использовать его бесплатно, но помните, что перепубликация кода подчиняется нашим Правилам поведения.
Отказ от ответственности
Информация и публикации не предназначены для предоставления и не являются финансовыми, инвестиционными, торговыми или другими видами советов или рекомендаций, предоставленных или одобренных TradingView. Подробнее читайте в Условиях использования.