OPEN-SOURCE SCRIPT
Обновлено Volatility & Big Market Moves

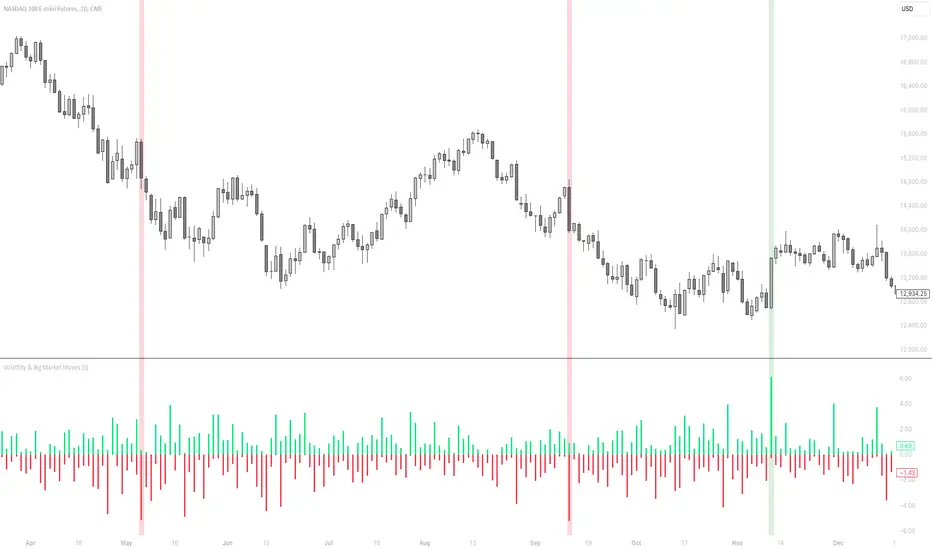
This indicator shows the volatility per candle, and highlights candles where volatility exceeds a defined threshold.
Data shown:
Furthest %-distance from the previous candle's closing price to the top (positive histogram).
Furthest %-distance from the previous candle's closing price to the bottom (negative histogram).
Data shown:
Furthest %-distance from the previous candle's closing price to the top (positive histogram).
Furthest %-distance from the previous candle's closing price to the bottom (negative histogram).
Информация о релизе
Slightly adjusted the calculation to calculate from the previous candle close instead of the current candle's high/low.Информация о релизе
"na" values in the histogram are now replaced with 0, so that the label on the scale shows the current candle's value at any time.Скрипт с открытым кодом
В истинном духе TradingView, создатель этого скрипта сделал его открытым исходным кодом, чтобы трейдеры могли проверить и убедиться в его функциональности. Браво автору! Вы можете использовать его бесплатно, но помните, что перепубликация кода подчиняется нашим Правилам поведения.
Отказ от ответственности
Информация и публикации не предназначены для предоставления и не являются финансовыми, инвестиционными, торговыми или другими видами советов или рекомендаций, предоставленных или одобренных TradingView. Подробнее читайте в Условиях использования.
Скрипт с открытым кодом
В истинном духе TradingView, создатель этого скрипта сделал его открытым исходным кодом, чтобы трейдеры могли проверить и убедиться в его функциональности. Браво автору! Вы можете использовать его бесплатно, но помните, что перепубликация кода подчиняется нашим Правилам поведения.
Отказ от ответственности
Информация и публикации не предназначены для предоставления и не являются финансовыми, инвестиционными, торговыми или другими видами советов или рекомендаций, предоставленных или одобренных TradingView. Подробнее читайте в Условиях использования.