MAPS - HiLo Divergence
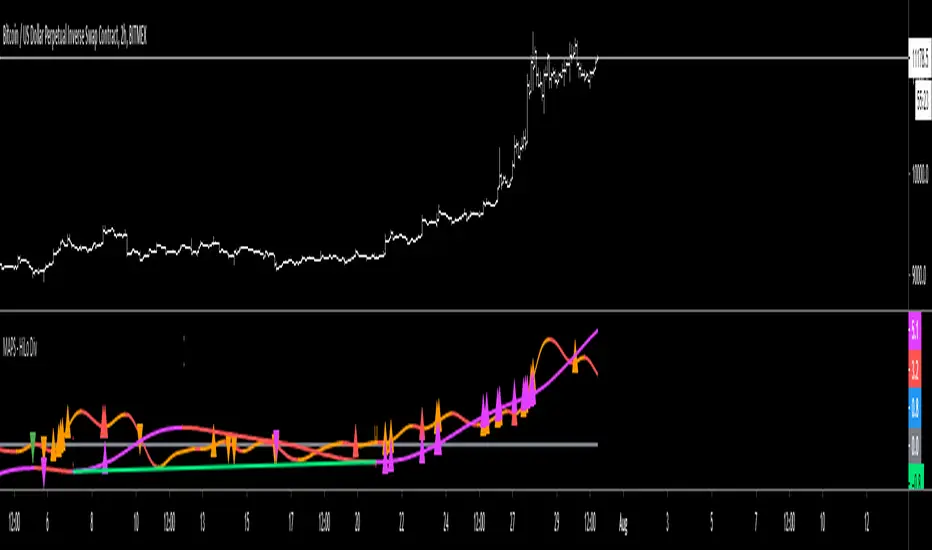
Purple oscillator = Higher Timeframe's price measurement
Purple high triangle = A local high on the higher timeframe has been made
Purple low triangle = A local low on the higher timeframe has been made
Red high triangle on the purple oscillator = A local high on the higher timeframe has been made and is deemed a bearish divergent high
Green low triangle on the purple oscillator = A local low on the higher timeframe has been made and is deemed a bullish divergent low
Orange oscillator = Current Timeframe's price measurement
Orange high triangle = A local high on the current timeframe has been made
Orange low triangle = A local low on the current timeframe has been made
Red high triangle on the orange oscillator = A local high on the current timeframe has been made and is deemed a bearish divergent high
Green low triangle on the orange oscillator = A local low on the current timeframe has been made and is deemed a bullish divergent low
Скрипт с ограниченным доступом
Доступ к этому скрипту имеют только пользователи, одобренные автором. Вам необходимо запросить и получить разрешение на его использование. Обычно оно предоставляется после оплаты. Для получения подробной информации следуйте инструкциям автора ниже или свяжитесь напрямую с TheTimeCount.
TradingView НЕ рекомендует оплачивать или использовать скрипт, если вы полностью не доверяете его автору и не понимаете, как он работает. Вы также можете найти бесплатные, открытые альтернативы в наших скриптах сообщества.
Инструкции от автора
Отказ от ответственности
Скрипт с ограниченным доступом
Доступ к этому скрипту имеют только пользователи, одобренные автором. Вам необходимо запросить и получить разрешение на его использование. Обычно оно предоставляется после оплаты. Для получения подробной информации следуйте инструкциям автора ниже или свяжитесь напрямую с TheTimeCount.
TradingView НЕ рекомендует оплачивать или использовать скрипт, если вы полностью не доверяете его автору и не понимаете, как он работает. Вы также можете найти бесплатные, открытые альтернативы в наших скриптах сообщества.