PROTECTED SOURCE SCRIPT
Scalping Dashboard - Volume Candles + Liquidity Zones
Scalping Dashboard - Volume Candles + Liquidity Zones
📊 Overview
A comprehensive scalping indicator designed for high-frequency traders on 1-5 minute timeframes. This all-in-one dashboard combines volume analysis, order flow metrics, technical indicators, and institutional liquidity zones to identify high-probability scalping opportunities.
🎯 Key Features
✅ Multi-Timeframe Analysis
Fast MACD (5/13/5) for momentum
Quick EMAs (9/20/50) for trend direction
Rapid Stochastic (5/3/3) for oversold/overbought conditions
Fast RSI (7) for extreme readings
✅ Advanced Order Flow Metrics
CVD (Cumulative Volume Delta): Tracks buy vs sell pressure over time
Delta Momentum: Measures acceleration in buying/selling
Buy/Sell Pressure Ratio: Real-time balance of market forces
Order Flow Imbalance: Detects aggressive buying or selling
Tape Speed: Measures how fast volume is hitting the market
✅ Institutional Liquidity Zones
Buy-Side Liquidity: Areas above price where short stop losses cluster
Sell-Side Liquidity: Areas below price where long stop losses cluster
Liquidity Sweeps: Detects "stop hunts" by institutions before reversals
✅ Volume-Based Candle Coloring
Visual representation of volume intensity
Extreme, High, Normal, and Low volume categories
Fully customizable color schemes
✅ Dynamic Support/Resistance
Volume-weighted price levels
Automatically updates every 3 bars
Shows distance to key levels
📈 Dashboard Indicators Explained
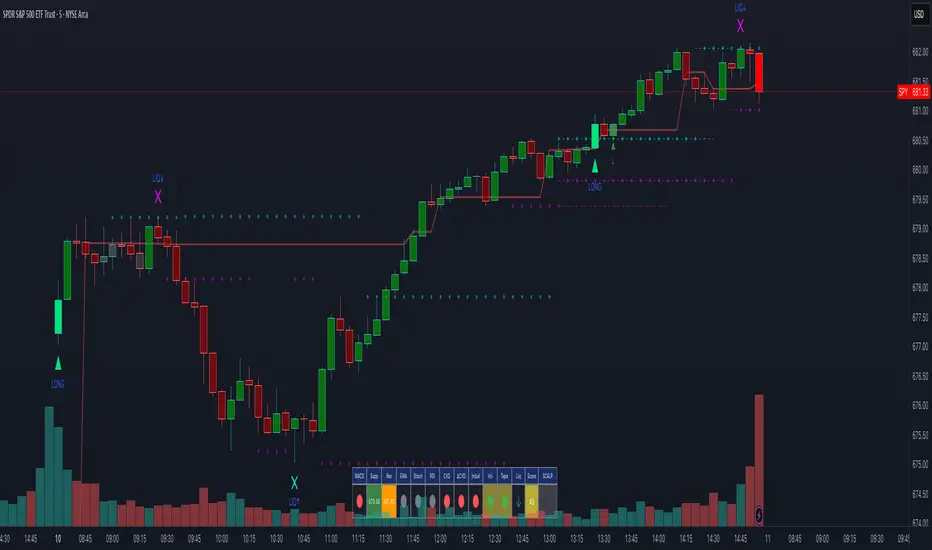
The bottom-left dashboard displays 14 real-time metrics:
▸ MACD (●)
Green = Bullish momentum
Red = Bearish momentum
Gray = Neutral
▸ Supp (Price)
Support level
Green highlight = at support (good for long entry)
▸ Res (Price)
Resistance level
Orange highlight = at resistance (good for short entry)
▸ EMA (●)
Green = Price above EMAs (bullish)
Red = Price below EMAs (bearish)
▸ Stoch (●)
Green = Oversold (<20)
Red = Overbought (>80)
Gray = Neutral
▸ RSI (●)
Green = Oversold (<30)
Red = Overbought (>70)
Gray = Neutral
▸ CVD (●)
Green = Cumulative buying pressure
Red = Cumulative selling pressure
▸ ΔCVD (●)
Green = Increasing buy pressure
Red = Increasing sell pressure
▸ Imbal (●)
Green = Buy imbalance (>2:1 ratio)
Red = Sell imbalance
▸ Vol (●)
Green/Yellow background = Volume surge (>2x average)
▸ Tape (●)
Green/Yellow background = Fast tape (>1.5x speed)
▸ Liq (↑↓●)
↑ = Bullish sweep or near sell-side liquidity
↓ = Bearish sweep or near buy-side liquidity
● = Neutral
▸ Score (#L or #S)
Quality score (0-8) for Long or Short setups
Higher numbers = Better quality trade
▸ SCALP (LONG/SHORT/WAIT)
Primary signal
Bright color = High quality (score ≥5)
Dim color = Decent quality (score =4)
Gray = Wait for better setup
🎨 Candle Color System
Volume-Based Colors
Bright Green/Red: Extreme volume (>2.5x average) - Major moves
Medium Green/Red: High volume (>1.5x average) - Strong activity
Dull Green/Red: Normal volume - Standard market activity
Gray: Low volume (<0.5x average) - Avoid trading
Signal-Based Colors
Lime: Strong Long signal (score ≥5)
Green: Decent Long signal (score =4)
Orange: Strong Short signal (score ≥5)
Red: Decent Short signal (score =4)
Candle Color Modes (adjustable in settings):
Volume Only: Pure volume intensity
Volume + Signals: Signals override volume when present (default)
Signals Only: Only shows entry signals
🔵 Chart Indicators
Support & Resistance Lines
Green Line: Volume-weighted support level
Red Line: Volume-weighted resistance level
Lines update dynamically based on 100-bar volume profile
Liquidity Zones
Cyan Circles/Dashed Lines: Buy-side liquidity (above price)
Where short stop losses cluster
Potential targets for bullish moves
Institutions may push price here before reversing down
Magenta Circles/Dashed Lines: Sell-side liquidity (below price)
Where long stop losses cluster
Potential targets for bearish moves
Institutions may push price here before reversing up
Entry Markers
Large Green Triangle (▲): High quality long entry (score ≥5)
Small Green Triangle (▲): Decent long entry (score =4)
Large Orange Triangle (▼): High quality short entry (score ≥5)
Small Red Triangle (▼): Decent short entry (score =4)
Liquidity Sweep Markers
Cyan X-Cross (below bar): Bullish liquidity sweep - "LIQ↑"
Price swept sell-side liquidity and reversed up
Strong buy signal
Magenta X-Cross (above bar): Bearish liquidity sweep - "LIQ↓"
Price swept buy-side liquidity and reversed down
Strong sell signal
🎯 How to Use This Indicator
For Long Scalps (Buy):
Wait for Dashboard Signal: SCALP = "LONG" with score ≥5
Confirm Multiple Green Dots: Look for EMA, CVD, ΔCVD, Imbal all green
Check Volume: Vol or Tape should show yellow background (surge)
Look for Confluence:
Price at or near Support level (green highlight)
Price near Sell-Side Liquidity (magenta line below)
RSI oversold (green dot)
Large green triangle appears on chart
Best Entry: On a bullish liquidity sweep (cyan X-cross)
For Short Scalps (Sell):
Wait for Dashboard Signal: SCALP = "SHORT" with score ≥5
Confirm Multiple Red Dots: Look for EMA, CVD, ΔCVD, Imbal all red
Check Volume: Vol or Tape should show yellow background (surge)
Look for Confluence:
Price at or near Resistance level (orange highlight)
Price near Buy-Side Liquidity (cyan line above)
RSI overbought (red dot)
Large orange triangle appears on chart
Best Entry: On a bearish liquidity sweep (magenta X-cross)
Three Types of Scalping Setups:
1. Quick Scalp (Fastest - 1-5 minute holds)
MACD or Stochastic crossover + Volume surge
At Support/Resistance level
Score ≥4
2. Momentum Scalp (Ride the wave - 5-15 minute holds)
Strong EMA alignment + CVD slope positive
Order flow imbalance + Fast tape
Volume surge with price structure
Score ≥5
3. Reversal Scalp (Fade extremes - 3-10 minute holds)
Stochastic + RSI extreme readings
At Support/Resistance OR liquidity sweep
CVD momentum reversal
Score ≥6
⚙️ Recommended Settings
Timeframes
Primary: 1-minute, 2-minute, 5-minute
Confirmation: Use 15-minute chart for overall trend direction
Asset Types
Forex pairs (high liquidity)
Crypto (BTC, ETH with high volume)
Futures (ES, NQ)
Major stocks during market hours
Risk Management
Target: 1-3 times your stop loss
Stop Loss: Below nearest liquidity zone for longs, above for shorts
Position Size: Never risk more than 1% per trade
Score ≥5: Take full position size
Score =4: Take half position size or skip
🔧 Customization Options
Input Groups
MACD Settings
Fast Length: 5 (scalping optimized)
Slow Length: 13
Signal Length: 5
EMA Settings
EMA 9, 20, 50 (fast scalping EMAs)
Stochastic Settings
%K Length: 5
%D Smoothing: 3
Smooth: 3
CVD Settings
MA Length: 10 (for CVD smoothing)
RSI Settings
Length: 7 (fast RSI)
Overbought: 70
Oversold: 30
Volume Settings
MA Length: 10
Extreme Multiplier: 2.5x
High Multiplier: 1.5x
Low Multiplier: 0.5x
Liquidity Zone Settings
Lookback Periods: 20
Swing Strength: 3
Show Liquidity Zones: On/Off
Show Liquidity Sweeps: On/Off
Support/Resistance Settings
Volume Lookback: 100 bars (~2 hours on 1-min chart)
Order Flow Settings
Imbalance Threshold: 2.0 (2:1 ratio)
Color Customization
All volume colors customizable
All signal colors customizable
All liquidity colors customizable
📊 Volume Legend (Top Right)
The small table in the top-right corner shows the volume intensity key:
Extreme: >2.5x average volume
High: >1.5x average volume
Normal: 0.5x to 1.5x average volume
Low: <0.5x average volume
🔔 Built-in Alerts
Set up these alerts to never miss a trade:
High Quality Long Scalp: Triggers when entry_long and score ≥5
High Quality Short Scalp: Triggers when entry_short and score ≥5
Bullish Liquidity Sweep: Triggers when sell-side liquidity is swept
Bearish Liquidity Sweep: Triggers when buy-side liquidity is swept
To set up: Right-click chart → Add Alert → Select condition → Create
💡 Pro Tips
Understanding Liquidity Zones
Buy-Side Liquidity = Where shorts have their stops = Price tends to wick up here
Sell-Side Liquidity = Where longs have their stops = Price tends to wick down here
Liquidity Sweep = Institution triggers stops, absorbs liquidity, then reverses
Best trades = Enter AFTER the sweep when price reverses back
Reading the Dashboard
All Green Dots + Yellow Volume = Strong Long Setup
All Red Dots + Yellow Volume = Strong Short Setup
Mixed Colors = Choppy/Neutral = Wait
Score 6+ = Highest probability trades
Score 3 or less = Avoid
Confluence is Key
Never trade on a single indicator. Wait for:
Dashboard score ≥5
Volume surge (yellow background)
At support/resistance OR liquidity zone
CVD and momentum aligned
Price structure confirmation (triangle marker)
Avoid These Situations
❌ Low volume periods (gray candles)
❌ Dashboard shows "WAIT"
❌ Score below 4
❌ No volume surge during entry
❌ Trading against higher timeframe trend
Best Trading Sessions
Forex: London open (3-5 AM EST), NY open (8-10 AM EST)
Crypto: Works 24/7, best during high volume periods
Stocks: First hour (9:30-10:30 AM EST), last hour (3-4 PM EST)
Futures: US session open (9:30 AM EST)
🎓 Understanding the Scoring System
The indicator calculates a quality score (0-8) for both long and short setups:
+1 point for each:
EMA bias aligned (price above/below EMA structure)
CVD momentum bias aligned (buying/selling pressure)
Buy/Sell pressure ratio aligned (>1.5x or <0.67x)
Volume strength (surge detected)
Order flow imbalance (>2:1 ratio)
Tape speed (>1.3x average)
Price structure (higher highs or lower lows)
Liquidity bias (sweep detected)
Score Interpretation:
7-8: Extremely high probability (rare, take immediately)
6: Very high probability (excellent trade)
5: High probability (good trade)
4: Decent probability (acceptable with tight stop)
3 or less: Low probability (wait for better setup)
📋 Quick Reference Card
Entry Checklist
Dashboard shows LONG or SHORT
Score is ≥5
Multiple indicators aligned (green or red dots)
Volume surge present (yellow background)
At support/resistance or liquidity zone
Triangle marker appeared on chart
Risk:Reward ratio is at least 1:2
Exit Strategy
Take Profit: At opposite liquidity zone or resistance/support
Stop Loss: Below sell-side liquidity (longs) or above buy-side liquidity (shorts)
Trail Stop: Move to breakeven after 1:1 risk:reward achieved
⚠️ Important Notes
This is NOT a holy grail: No indicator is 100% accurate. Always use proper risk management.
Backtest first: Paper trade or backtest on your specific instrument before using real money.
Market conditions matter: This indicator works best in trending or volatile markets, not in tight consolidation.
Combine with price action: Use the indicator as confluence with your own price action reading.
Adjust for your instrument: Different assets may require tweaking the sensitivity settings.
Lower timeframes = More noise: 1-minute charts have more false signals than 5-minute charts.
🔄 Version History
v1.0 - Initial release
Multi-indicator dashboard
Volume-based candle coloring
Support/Resistance detection
Entry signal generation
v2.0 - Current version
Added liquidity zone detection
Added liquidity sweep identification
Enhanced scoring system (now 0-8)
Added liquidity bias to entries
New alerts for liquidity sweeps
Improved dashboard with Liq indicator
📞 Support & Feedback
If you find this indicator helpful, please:
⭐ Give it a boost
💬 Share your results in the comments
🐛 Report any bugs or issues
💡 Suggest improvements
Disclaimer: This indicator is for educational purposes only. Trading involves significant risk. Past performance does not guarantee future results. Always trade responsibly and never risk more than you can afford to lose.
🏆 Credits
Created for serious scalpers who want institutional-level insights on retail charts. Combines order flow analysis, volume profiling, and liquidity mapping into one comprehensive tool.
Happy Scalping! 🚀📈
📊 Overview
A comprehensive scalping indicator designed for high-frequency traders on 1-5 minute timeframes. This all-in-one dashboard combines volume analysis, order flow metrics, technical indicators, and institutional liquidity zones to identify high-probability scalping opportunities.
🎯 Key Features
✅ Multi-Timeframe Analysis
Fast MACD (5/13/5) for momentum
Quick EMAs (9/20/50) for trend direction
Rapid Stochastic (5/3/3) for oversold/overbought conditions
Fast RSI (7) for extreme readings
✅ Advanced Order Flow Metrics
CVD (Cumulative Volume Delta): Tracks buy vs sell pressure over time
Delta Momentum: Measures acceleration in buying/selling
Buy/Sell Pressure Ratio: Real-time balance of market forces
Order Flow Imbalance: Detects aggressive buying or selling
Tape Speed: Measures how fast volume is hitting the market
✅ Institutional Liquidity Zones
Buy-Side Liquidity: Areas above price where short stop losses cluster
Sell-Side Liquidity: Areas below price where long stop losses cluster
Liquidity Sweeps: Detects "stop hunts" by institutions before reversals
✅ Volume-Based Candle Coloring
Visual representation of volume intensity
Extreme, High, Normal, and Low volume categories
Fully customizable color schemes
✅ Dynamic Support/Resistance
Volume-weighted price levels
Automatically updates every 3 bars
Shows distance to key levels
📈 Dashboard Indicators Explained
The bottom-left dashboard displays 14 real-time metrics:
▸ MACD (●)
Green = Bullish momentum
Red = Bearish momentum
Gray = Neutral
▸ Supp (Price)
Support level
Green highlight = at support (good for long entry)
▸ Res (Price)
Resistance level
Orange highlight = at resistance (good for short entry)
▸ EMA (●)
Green = Price above EMAs (bullish)
Red = Price below EMAs (bearish)
▸ Stoch (●)
Green = Oversold (<20)
Red = Overbought (>80)
Gray = Neutral
▸ RSI (●)
Green = Oversold (<30)
Red = Overbought (>70)
Gray = Neutral
▸ CVD (●)
Green = Cumulative buying pressure
Red = Cumulative selling pressure
▸ ΔCVD (●)
Green = Increasing buy pressure
Red = Increasing sell pressure
▸ Imbal (●)
Green = Buy imbalance (>2:1 ratio)
Red = Sell imbalance
▸ Vol (●)
Green/Yellow background = Volume surge (>2x average)
▸ Tape (●)
Green/Yellow background = Fast tape (>1.5x speed)
▸ Liq (↑↓●)
↑ = Bullish sweep or near sell-side liquidity
↓ = Bearish sweep or near buy-side liquidity
● = Neutral
▸ Score (#L or #S)
Quality score (0-8) for Long or Short setups
Higher numbers = Better quality trade
▸ SCALP (LONG/SHORT/WAIT)
Primary signal
Bright color = High quality (score ≥5)
Dim color = Decent quality (score =4)
Gray = Wait for better setup
🎨 Candle Color System
Volume-Based Colors
Bright Green/Red: Extreme volume (>2.5x average) - Major moves
Medium Green/Red: High volume (>1.5x average) - Strong activity
Dull Green/Red: Normal volume - Standard market activity
Gray: Low volume (<0.5x average) - Avoid trading
Signal-Based Colors
Lime: Strong Long signal (score ≥5)
Green: Decent Long signal (score =4)
Orange: Strong Short signal (score ≥5)
Red: Decent Short signal (score =4)
Candle Color Modes (adjustable in settings):
Volume Only: Pure volume intensity
Volume + Signals: Signals override volume when present (default)
Signals Only: Only shows entry signals
🔵 Chart Indicators
Support & Resistance Lines
Green Line: Volume-weighted support level
Red Line: Volume-weighted resistance level
Lines update dynamically based on 100-bar volume profile
Liquidity Zones
Cyan Circles/Dashed Lines: Buy-side liquidity (above price)
Where short stop losses cluster
Potential targets for bullish moves
Institutions may push price here before reversing down
Magenta Circles/Dashed Lines: Sell-side liquidity (below price)
Where long stop losses cluster
Potential targets for bearish moves
Institutions may push price here before reversing up
Entry Markers
Large Green Triangle (▲): High quality long entry (score ≥5)
Small Green Triangle (▲): Decent long entry (score =4)
Large Orange Triangle (▼): High quality short entry (score ≥5)
Small Red Triangle (▼): Decent short entry (score =4)
Liquidity Sweep Markers
Cyan X-Cross (below bar): Bullish liquidity sweep - "LIQ↑"
Price swept sell-side liquidity and reversed up
Strong buy signal
Magenta X-Cross (above bar): Bearish liquidity sweep - "LIQ↓"
Price swept buy-side liquidity and reversed down
Strong sell signal
🎯 How to Use This Indicator
For Long Scalps (Buy):
Wait for Dashboard Signal: SCALP = "LONG" with score ≥5
Confirm Multiple Green Dots: Look for EMA, CVD, ΔCVD, Imbal all green
Check Volume: Vol or Tape should show yellow background (surge)
Look for Confluence:
Price at or near Support level (green highlight)
Price near Sell-Side Liquidity (magenta line below)
RSI oversold (green dot)
Large green triangle appears on chart
Best Entry: On a bullish liquidity sweep (cyan X-cross)
For Short Scalps (Sell):
Wait for Dashboard Signal: SCALP = "SHORT" with score ≥5
Confirm Multiple Red Dots: Look for EMA, CVD, ΔCVD, Imbal all red
Check Volume: Vol or Tape should show yellow background (surge)
Look for Confluence:
Price at or near Resistance level (orange highlight)
Price near Buy-Side Liquidity (cyan line above)
RSI overbought (red dot)
Large orange triangle appears on chart
Best Entry: On a bearish liquidity sweep (magenta X-cross)
Three Types of Scalping Setups:
1. Quick Scalp (Fastest - 1-5 minute holds)
MACD or Stochastic crossover + Volume surge
At Support/Resistance level
Score ≥4
2. Momentum Scalp (Ride the wave - 5-15 minute holds)
Strong EMA alignment + CVD slope positive
Order flow imbalance + Fast tape
Volume surge with price structure
Score ≥5
3. Reversal Scalp (Fade extremes - 3-10 minute holds)
Stochastic + RSI extreme readings
At Support/Resistance OR liquidity sweep
CVD momentum reversal
Score ≥6
⚙️ Recommended Settings
Timeframes
Primary: 1-minute, 2-minute, 5-minute
Confirmation: Use 15-minute chart for overall trend direction
Asset Types
Forex pairs (high liquidity)
Crypto (BTC, ETH with high volume)
Futures (ES, NQ)
Major stocks during market hours
Risk Management
Target: 1-3 times your stop loss
Stop Loss: Below nearest liquidity zone for longs, above for shorts
Position Size: Never risk more than 1% per trade
Score ≥5: Take full position size
Score =4: Take half position size or skip
🔧 Customization Options
Input Groups
MACD Settings
Fast Length: 5 (scalping optimized)
Slow Length: 13
Signal Length: 5
EMA Settings
EMA 9, 20, 50 (fast scalping EMAs)
Stochastic Settings
%K Length: 5
%D Smoothing: 3
Smooth: 3
CVD Settings
MA Length: 10 (for CVD smoothing)
RSI Settings
Length: 7 (fast RSI)
Overbought: 70
Oversold: 30
Volume Settings
MA Length: 10
Extreme Multiplier: 2.5x
High Multiplier: 1.5x
Low Multiplier: 0.5x
Liquidity Zone Settings
Lookback Periods: 20
Swing Strength: 3
Show Liquidity Zones: On/Off
Show Liquidity Sweeps: On/Off
Support/Resistance Settings
Volume Lookback: 100 bars (~2 hours on 1-min chart)
Order Flow Settings
Imbalance Threshold: 2.0 (2:1 ratio)
Color Customization
All volume colors customizable
All signal colors customizable
All liquidity colors customizable
📊 Volume Legend (Top Right)
The small table in the top-right corner shows the volume intensity key:
Extreme: >2.5x average volume
High: >1.5x average volume
Normal: 0.5x to 1.5x average volume
Low: <0.5x average volume
🔔 Built-in Alerts
Set up these alerts to never miss a trade:
High Quality Long Scalp: Triggers when entry_long and score ≥5
High Quality Short Scalp: Triggers when entry_short and score ≥5
Bullish Liquidity Sweep: Triggers when sell-side liquidity is swept
Bearish Liquidity Sweep: Triggers when buy-side liquidity is swept
To set up: Right-click chart → Add Alert → Select condition → Create
💡 Pro Tips
Understanding Liquidity Zones
Buy-Side Liquidity = Where shorts have their stops = Price tends to wick up here
Sell-Side Liquidity = Where longs have their stops = Price tends to wick down here
Liquidity Sweep = Institution triggers stops, absorbs liquidity, then reverses
Best trades = Enter AFTER the sweep when price reverses back
Reading the Dashboard
All Green Dots + Yellow Volume = Strong Long Setup
All Red Dots + Yellow Volume = Strong Short Setup
Mixed Colors = Choppy/Neutral = Wait
Score 6+ = Highest probability trades
Score 3 or less = Avoid
Confluence is Key
Never trade on a single indicator. Wait for:
Dashboard score ≥5
Volume surge (yellow background)
At support/resistance OR liquidity zone
CVD and momentum aligned
Price structure confirmation (triangle marker)
Avoid These Situations
❌ Low volume periods (gray candles)
❌ Dashboard shows "WAIT"
❌ Score below 4
❌ No volume surge during entry
❌ Trading against higher timeframe trend
Best Trading Sessions
Forex: London open (3-5 AM EST), NY open (8-10 AM EST)
Crypto: Works 24/7, best during high volume periods
Stocks: First hour (9:30-10:30 AM EST), last hour (3-4 PM EST)
Futures: US session open (9:30 AM EST)
🎓 Understanding the Scoring System
The indicator calculates a quality score (0-8) for both long and short setups:
+1 point for each:
EMA bias aligned (price above/below EMA structure)
CVD momentum bias aligned (buying/selling pressure)
Buy/Sell pressure ratio aligned (>1.5x or <0.67x)
Volume strength (surge detected)
Order flow imbalance (>2:1 ratio)
Tape speed (>1.3x average)
Price structure (higher highs or lower lows)
Liquidity bias (sweep detected)
Score Interpretation:
7-8: Extremely high probability (rare, take immediately)
6: Very high probability (excellent trade)
5: High probability (good trade)
4: Decent probability (acceptable with tight stop)
3 or less: Low probability (wait for better setup)
📋 Quick Reference Card
Entry Checklist
Dashboard shows LONG or SHORT
Score is ≥5
Multiple indicators aligned (green or red dots)
Volume surge present (yellow background)
At support/resistance or liquidity zone
Triangle marker appeared on chart
Risk:Reward ratio is at least 1:2
Exit Strategy
Take Profit: At opposite liquidity zone or resistance/support
Stop Loss: Below sell-side liquidity (longs) or above buy-side liquidity (shorts)
Trail Stop: Move to breakeven after 1:1 risk:reward achieved
⚠️ Important Notes
This is NOT a holy grail: No indicator is 100% accurate. Always use proper risk management.
Backtest first: Paper trade or backtest on your specific instrument before using real money.
Market conditions matter: This indicator works best in trending or volatile markets, not in tight consolidation.
Combine with price action: Use the indicator as confluence with your own price action reading.
Adjust for your instrument: Different assets may require tweaking the sensitivity settings.
Lower timeframes = More noise: 1-minute charts have more false signals than 5-minute charts.
🔄 Version History
v1.0 - Initial release
Multi-indicator dashboard
Volume-based candle coloring
Support/Resistance detection
Entry signal generation
v2.0 - Current version
Added liquidity zone detection
Added liquidity sweep identification
Enhanced scoring system (now 0-8)
Added liquidity bias to entries
New alerts for liquidity sweeps
Improved dashboard with Liq indicator
📞 Support & Feedback
If you find this indicator helpful, please:
⭐ Give it a boost
💬 Share your results in the comments
🐛 Report any bugs or issues
💡 Suggest improvements
Disclaimer: This indicator is for educational purposes only. Trading involves significant risk. Past performance does not guarantee future results. Always trade responsibly and never risk more than you can afford to lose.
🏆 Credits
Created for serious scalpers who want institutional-level insights on retail charts. Combines order flow analysis, volume profiling, and liquidity mapping into one comprehensive tool.
Happy Scalping! 🚀📈
Скрипт с защищённым кодом
Этот скрипт опубликован с закрытым исходным кодом. Однако вы можете использовать его свободно и без каких-либо ограничений — читайте подробнее здесь.
Отказ от ответственности
Информация и публикации не предназначены для предоставления и не являются финансовыми, инвестиционными, торговыми или другими видами советов или рекомендаций, предоставленных или одобренных TradingView. Подробнее читайте в Условиях использования.