OPEN-SOURCE SCRIPT
Pressure Volume by Molnar
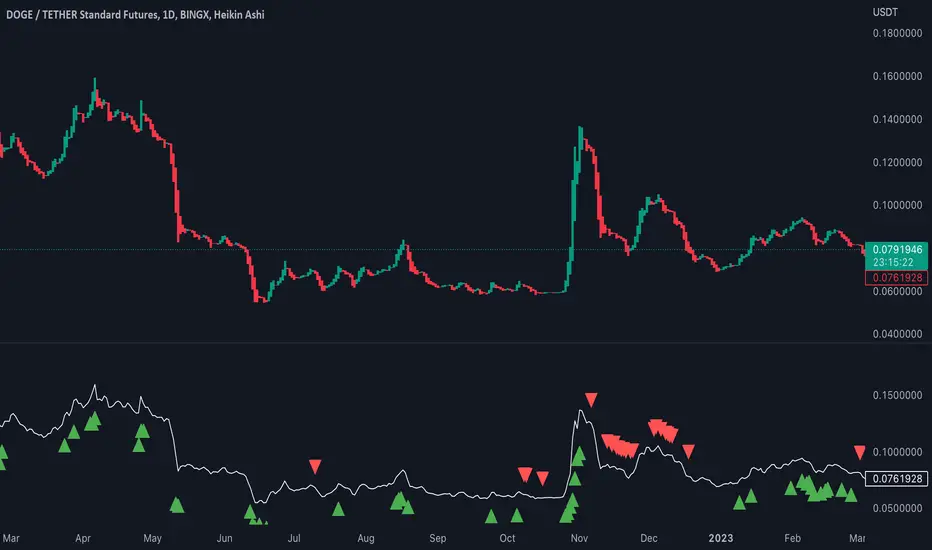
The Pressure Volume script is a technical indicator that is used to identify buying and selling pressure in a market based on changes in volume. The indicator calculates the average volume over a specified lookback period and then calculates the percentage change in volume for each bar. If the percentage change in volume exceeds a user-defined threshold, then the indicator signals the presence of buying or selling pressure.
To use the script, you simply need to add it to a chart in TradingView. The script allows you to adjust two input parameters: the lookback period and the threshold percentage. The lookback period is the number of bars to use when calculating the average volume, and the threshold percentage is the amount by which the current bar's volume must exceed the average volume in order to trigger a buying or selling pressure signal.
When the script detects buying pressure, it displays a green triangle above the bar, and when it detects selling pressure, it displays a red triangle below the bar. You can adjust the size of the triangles using the "size" input parameter.
It's important to note that the Pressure Volume script is just one tool among many that traders use to analyze the market. It should be used in conjunction with other indicators and analysis techniques to make informed trading decisions.
Скрипт с открытым кодом
В истинном духе TradingView, создатель этого скрипта сделал его открытым исходным кодом, чтобы трейдеры могли проверить и убедиться в его функциональности. Браво автору! Вы можете использовать его бесплатно, но помните, что перепубликация кода подчиняется нашим Правилам поведения.
Отказ от ответственности
Информация и публикации не предназначены для предоставления и не являются финансовыми, инвестиционными, торговыми или другими видами советов или рекомендаций, предоставленных или одобренных TradingView. Подробнее читайте в Условиях использования.