OPEN-SOURCE SCRIPT
Recursive Moving Average Difference

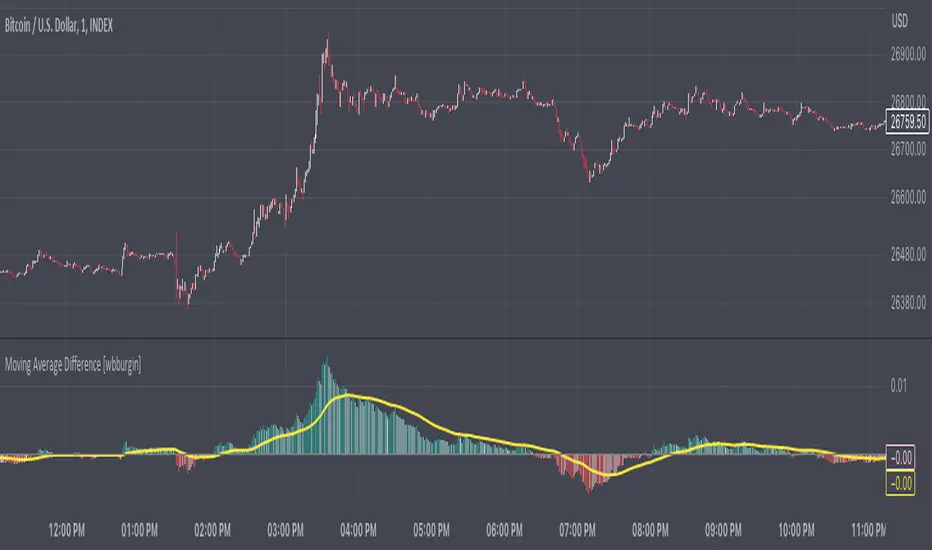
The relative difference between a moving average and the price can be a useful tool for interpreting trend direction and identifying pullbacks or breakdowns. This indicator recursively finds all the relative moving average differences between two simple moving averages of your choosing and weighs them by their lengths. It then returns a value that represents the weighted average of all the moving average differences. This can represent the gradient of motion between moving averages, or the path of least resistance, which the price may revert to in certain situations.
For the settings: minimum MA represents the minimum simple moving average to consider for the total weighted average. Maximum MA represents the maximum simple moving average to consider. "Move By" is the increment that you want to move between these two moving averages.
A positive moving average difference indicates that the price is above the moving average difference (i.e. the weighted average of all moving average differences between your two selected moving averages). A negative moving average difference indicates that the price is below the moving average difference. I have added a signal with a configurable length input as well to smooth out trends.
You can configure colors and lengths, as well as the counting increment. Future updates may include different ways to calculate weights, perhaps on overlay or strategy.
Скрипт с открытым кодом
В истинном духе TradingView, создатель этого скрипта сделал его открытым исходным кодом, чтобы трейдеры могли проверить и убедиться в его функциональности. Браво автору! Вы можете использовать его бесплатно, но помните, что перепубликация кода подчиняется нашим Правилам поведения.
FAQ: I am gradually phasing out my Patreon because of the time it takes to maintain.
BTC: 35PdMMMXFCvPjXKwn8wsRFNwMEPgStaKUJ
Test my strategies on CryptoRobotics: cryptorobotics.co/?trade=f23b09
BTC: 35PdMMMXFCvPjXKwn8wsRFNwMEPgStaKUJ
Test my strategies on CryptoRobotics: cryptorobotics.co/?trade=f23b09
Отказ от ответственности
Информация и публикации не предназначены для предоставления и не являются финансовыми, инвестиционными, торговыми или другими видами советов или рекомендаций, предоставленных или одобренных TradingView. Подробнее читайте в Условиях использования.