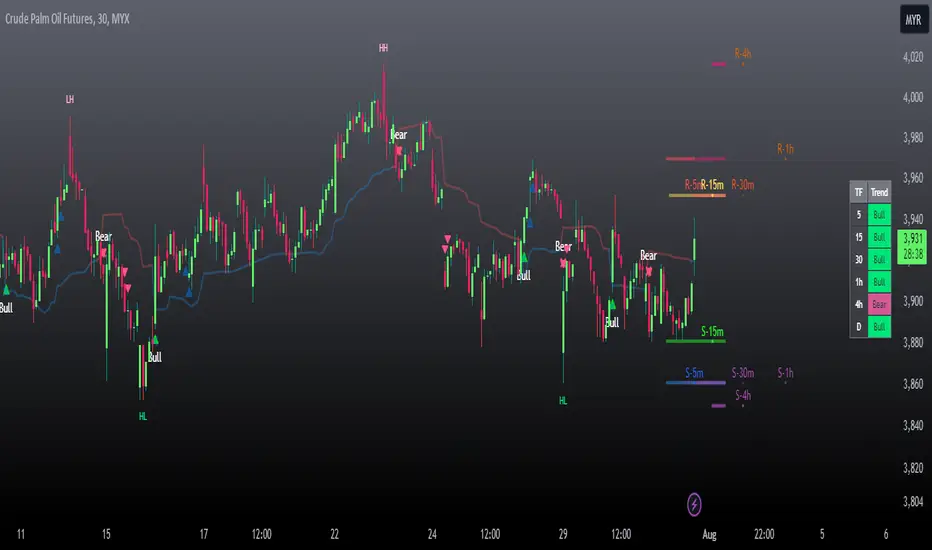
Swing Rapat Jik ( LOW-HIGH ) Smart Money TrendBand

( 2023 updated edition )
The Swing Rapat Jik indicator is a method of knowing whether the current market is either at the highest or the lowest price.
It is also a relatively less risky strategy and suitable for long-term traders such as swing traders.
The analysis tool used is based on the Relative Strength Index ( RSI ) indicator as a parameter to measure the lowest price and the highest price in each cycle. If the price is at the extremely oversold level, then it shows the lowest price signal (LL/HL). Vice versa, if the price is at the extreme overbought level, then the signal will show the highest price signal (HH/LH).
It should be noted that this indicator is a repaint where it will make a re-mark if the price is at the lowest level of the previous signal. So, the solution is that I’ve added the Moving Average parameter as confirmation of the reversal of the LL price to the uptrend. That means the signal to enter the market only occurs when there is an Entry Price (EP) signal after LL/HL signal appears.
Please, do not enter the market when the EP signal is released if the LL/HL signal is not yet released. Make sure these two signals come out consecutively, starting with HL/LL and then the EP signal.
Key Signal;
LL = LOWER LOW
HL = HIGHER LOW
HH = HIGHER HIGH/TAKE PROFIT
LH = LOWER HIGH/TAKE PROFIT
EP = ENTRY PRICE
Hopefully, it can help traders to track the price at the lowest level before making a reversal and the highest price during the market supply situation.
*So far, the invention of the entry market is for the stock market only, which is to use buy signals only. Any updates for other markets will be notified from time to time.
Major updates;
1. Update version to Version 5 pine script
2. variable value used for the EP signal, to obtain a more significant weighted value.
3. Change of label color
4. Colored bars- bullish and bearish trends detected
SOPs and strategies
colored bars are pointers of the current trend and the period in which it occurred.
Use this combination as a strong confirmation
2. re-organized the plot and shape for defaults setting
Скрипт с ограниченным доступом
Доступ к этому скрипту имеют только пользователи, одобренные автором. Вам необходимо запросить и получить разрешение на его использование. Обычно оно предоставляется после оплаты. Для получения подробной информации следуйте инструкциям автора ниже или свяжитесь напрямую с TraderAsist.
TradingView НЕ рекомендует оплачивать или использовать скрипт, если вы полностью не доверяете его автору и не понимаете, как он работает. Вы также можете найти бесплатные, открытые альтернативы в наших скриптах сообщества.
Инструкции от автора
Отказ от ответственности
Скрипт с ограниченным доступом
Доступ к этому скрипту имеют только пользователи, одобренные автором. Вам необходимо запросить и получить разрешение на его использование. Обычно оно предоставляется после оплаты. Для получения подробной информации следуйте инструкциям автора ниже или свяжитесь напрямую с TraderAsist.
TradingView НЕ рекомендует оплачивать или использовать скрипт, если вы полностью не доверяете его автору и не понимаете, как он работает. Вы также можете найти бесплатные, открытые альтернативы в наших скриптах сообщества.