OPEN-SOURCE SCRIPT
Candle Breakdown with Solid Tops/Bottoms
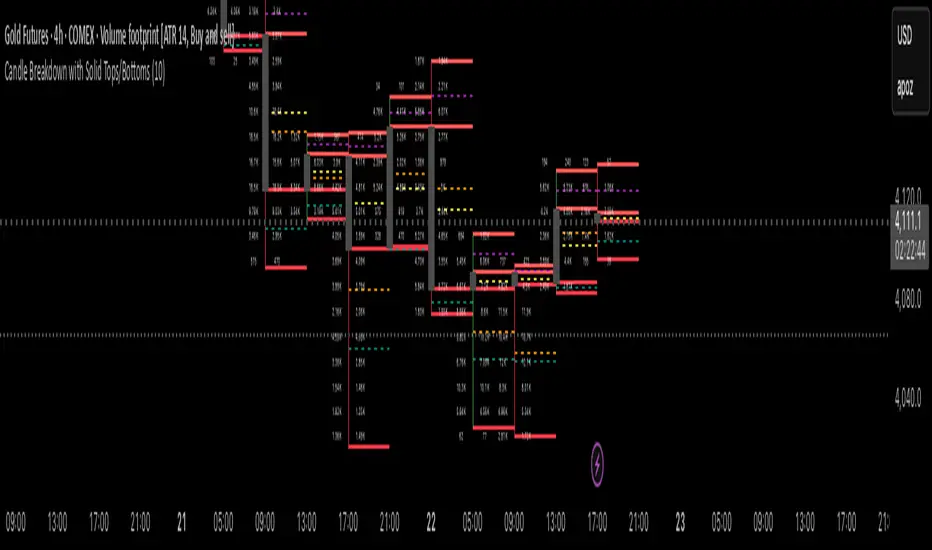
I use 4hr pivots and targets and trade 1min
This Pine Script v5 indicator for TradingView, named "Candle Breakdown with Solid Tops/Bottoms," visually dissects each candlestick into four sections: whole candle (low to high), top wick (body top to high), body (open to close), and bottom wick (low to body bottom). For each section, it plots:Solid horizontal lines (width=2) at the top and bottom (e.g., high/low for whole candle, body top/bottom for body).
Dashed horizontal midlines (width=1) at the midpoint of each section (e.g., (high + low)/2 for whole candle).
Key features include:
Toggles: Enable/disable each section (whole, top wick, body, bottom wick) via checkboxes.
Custom Colors: Separate color inputs for top/bottom lines and midlines (defaults: gray, red, blue, green for sections; orange, purple, yellow, teal for midlines).
Lookback: User-defined input (default 10 candles) limits lines to the last N candles for clarity.
Labels: Optional price labels on the last bar for debugging.
The script uses line.new() for dynamic, per-candle lines, ensuring no errors (e.g., no invalid linestyle or linewidth<1). It’s efficient (up to 12 lines/candle, stays under max_lines_count=500) and works on any symbol/timeframe, enhancing swing trading analysis (e.g., for GC1! or NQ1!).
Скрипт с открытым кодом
В истинном духе TradingView автор этого скрипта опубликовал его с открытым исходным кодом, чтобы трейдеры могли понять, как он работает, и проверить на практике. Вы можете воспользоваться им бесплатно, но повторное использование этого кода в публикации регулируется Правилами поведения.
Отказ от ответственности
Все виды контента, которые вы можете увидеть на TradingView, не являются финансовыми, инвестиционными, торговыми или любыми другими рекомендациями. Мы не предоставляем советы по покупке и продаже активов. Подробнее — в Условиях использования TradingView.