TwP: Financials on Charts
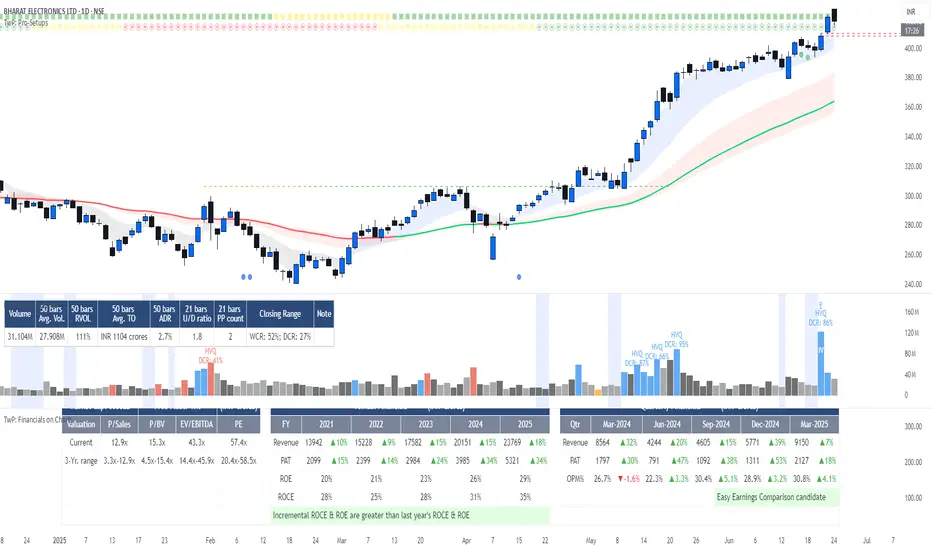
> An Info Panel, with the financial snapshot of the company, such as its market capitalization, annual & quarterly financials, Y/Y growth numbers, profitability margins, RoE & RoCE, and valuation ratios.
> EBITDA and PAT margins over a period of time.
> RoE and RoCE ratios over a period of time.
> Valuation multiples over a period of time.
> A comparison of margins, return ratios, and valuation multiples with any peer-group company.
Info Panel
This gives a quick snapshot of the financials of the company, which includes annual & quarterly Revenue, EBITDA, PAT, margins with Y/Y changes, Debt-Equity ratio, ROE, ROCE, and valuation multiples.
Profitability & Return Ratios
You can view quarterly as well as annual EBITDA & PAT margins and annual RoE, RoCE. You can choose to see these ratios either only for the company or can also add a peer company to compare.
Valuation Ratios
You can view TTM valuation ratios such as EV/Sales, EV/EBITDA, P/BV & P/E multiples. You can choose to see these valuation multiples either only for the company or can also add a peer company to compare.
- Added option to see chart for certain line items (Revenue, EBITDA and PAT) on Annual & Quarterly basis.
*Added a Note in the Settings box to clarify that Line items can be seen on annual & quarterly basis; Under Ratios, Profit margins can be seen on annual & quarterly basis; RoE and ROCE are on the basis of last Financial Year; and Valuation Ratios are on Trailing Twelve Months (TTM) basis.
- ROE and ROCE also can now be seen separately.
- Changed the default colors for better peer company comparison.
- Removed unwanted code.
There are three tables that get printed on your chart:
• Table 1: This gives you information on the market cap, free float, current valuation and 3-year valuation range.
• Table 2: Annual financial numbers.
• Table 3: Quarterly financial numbers.
Plus, Table 3 also tells you if the company has accelerated sales and earnings in last two-three quarters, or is meeting Code 33 condition as laid out by Mark Minervini.
From the settings tab, you can:
- Change the scale for the financial numbers (Billion, Million, Crores, Lakhs, None).
- Adjust the size of the tables to fit in your chart.
- Change the color of the table and text.
This update is useful for those who are not interested in looking at the whole financial table, but still want to know the company's performance and potential such as Accelerated Earnings, Code 33 or Easy Earnings Comparison.
From the Settings, you can choose to see only the Key Notes, instead of the Financials Summary. This will only print Key Notes, if any, like in the chart below:
You can move up the Key Notes part to the Pro-Setups or Volume Script too.
Where previous year's financials were not available, the table used to show '1970' as the year. This has been corrected and the table header in such cases will show blank now.
Скрипт с ограниченным доступом
Только пользователи, одобренные автором, могут получить доступ к этому скрипту. Вам нужно отправить запрос и получить разрешение на его использование. Обычно доступ предоставляется после оплаты. Для получения подробной информации следуйте инструкциям автора ниже или свяжитесь с Pro-Setups напрямую.
TradingView НЕ рекомендует платить за скрипт или использовать его, если вы не доверяете его автору и не понимаете, как скрипт работает. Вы всегда можете найти бесплатные скрипты с открытым исходным кодом в Скриптах сообщества.
Инструкции от автора
Внимание: перед тем как запрашивать доступ, прочитайте наши правила для скриптов с ограниченным доступом.
For details, please visit pro-setups.com
Отказ от ответственности
Скрипт с ограниченным доступом
Только пользователи, одобренные автором, могут получить доступ к этому скрипту. Вам нужно отправить запрос и получить разрешение на его использование. Обычно доступ предоставляется после оплаты. Для получения подробной информации следуйте инструкциям автора ниже или свяжитесь с Pro-Setups напрямую.
TradingView НЕ рекомендует платить за скрипт или использовать его, если вы не доверяете его автору и не понимаете, как скрипт работает. Вы всегда можете найти бесплатные скрипты с открытым исходным кодом в Скриптах сообщества.
Инструкции от автора
Внимание: перед тем как запрашивать доступ, прочитайте наши правила для скриптов с ограниченным доступом.
For details, please visit pro-setups.com