OPEN-SOURCE SCRIPT
Обновлено [JHF] Asset Performance Ratio
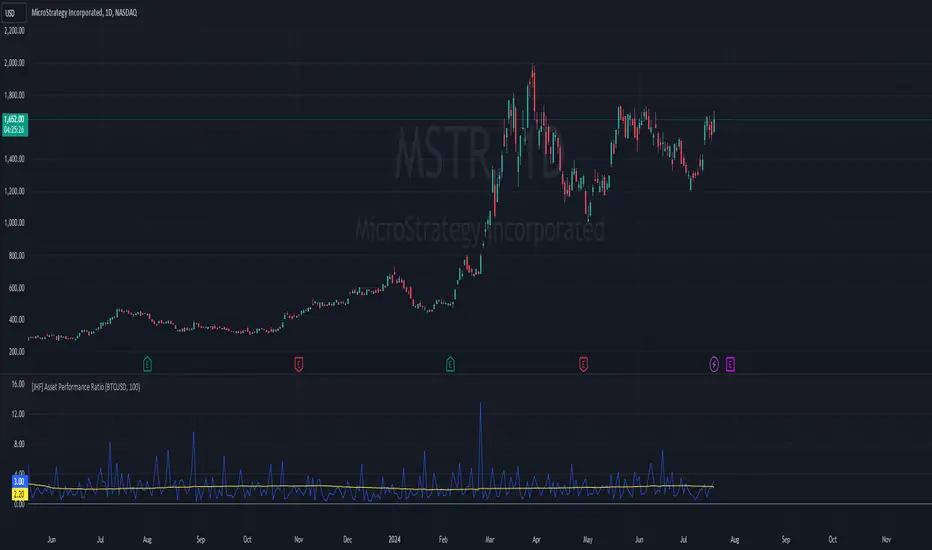
The Asset Performance Ratio indicator compares the performance of the current chart's asset (Asset 1) with a baseline asset (Asset 2). This indicator calculates the candle range for both assets in percentage terms and computes the multiplier of Asset 1's range relative to Asset 2's range. It also provides a moving average of this multiplier over a specified period.
Features:
Inputs:
How It Works:
Example Use Case:
Use this indicator to compare the volatility or performance of a stock against a cryptocurrency, providing insights into their relative movements and aiding in making informed trading decisions.
Features:
- Baseline Asset Selection: Choose any asset as the baseline for comparison.
- Period Customization: Set the period for the moving average to suit your analysis.
- Dynamic Calculation: Automatically uses the current chart's ticker as Asset 1.
- Visual Representation: Plots both the multiplier and its moving average for easy interpretation.
Inputs:
- Baseline Asset (Default: BTCUSD): The ticker symbol of the baseline asset against which the current chart's asset is compared.
- Period (Default: 100): The number of periods over which the moving average of the multiplier is calculated.
How It Works:
- Candle Data Retrieval:
- The script fetches high, low, open, and close prices for both the current chart's asset and the baseline asset.
- Percentage Range Calculation:
- Calculates the candle range as a percentage of the opening price for both assets.
- Multiplier Calculation:
- Computes the multiplier as the ratio of the percentage range of the current chart's asset to that of the baseline asset.
- Moving Average Calculation:
- Calculates the simple moving average (SMA) of the multiplier over the specified period.
- Plotting:
- Plots the multiplier and its moving average for easy visual comparison.
Example Use Case:
Use this indicator to compare the volatility or performance of a stock against a cryptocurrency, providing insights into their relative movements and aiding in making informed trading decisions.
Информация о релизе
Updated Chart.Информация о релизе
Updated labelsСкрипт с открытым кодом
В истинном духе TradingView, создатель этого скрипта сделал его открытым исходным кодом, чтобы трейдеры могли проверить и убедиться в его функциональности. Браво автору! Вы можете использовать его бесплатно, но помните, что перепубликация кода подчиняется нашим Правилам поведения.
The Real World - Stocks Campus:
Stocks, Options, Futures, Forex, Crypto, this is what we trade.
Learn profitable trading systems or build your own, just like I did.
jointherealworld.com/?a=tkbmft8bqf
Stocks, Options, Futures, Forex, Crypto, this is what we trade.
Learn profitable trading systems or build your own, just like I did.
jointherealworld.com/?a=tkbmft8bqf
Отказ от ответственности
Информация и публикации не предназначены для предоставления и не являются финансовыми, инвестиционными, торговыми или другими видами советов или рекомендаций, предоставленных или одобренных TradingView. Подробнее читайте в Условиях использования.
Скрипт с открытым кодом
В истинном духе TradingView, создатель этого скрипта сделал его открытым исходным кодом, чтобы трейдеры могли проверить и убедиться в его функциональности. Браво автору! Вы можете использовать его бесплатно, но помните, что перепубликация кода подчиняется нашим Правилам поведения.
The Real World - Stocks Campus:
Stocks, Options, Futures, Forex, Crypto, this is what we trade.
Learn profitable trading systems or build your own, just like I did.
jointherealworld.com/?a=tkbmft8bqf
Stocks, Options, Futures, Forex, Crypto, this is what we trade.
Learn profitable trading systems or build your own, just like I did.
jointherealworld.com/?a=tkbmft8bqf
Отказ от ответственности
Информация и публикации не предназначены для предоставления и не являются финансовыми, инвестиционными, торговыми или другими видами советов или рекомендаций, предоставленных или одобренных TradingView. Подробнее читайте в Условиях использования.