OPEN-SOURCE SCRIPT
No Wick Candlestick Identifier_GOVS

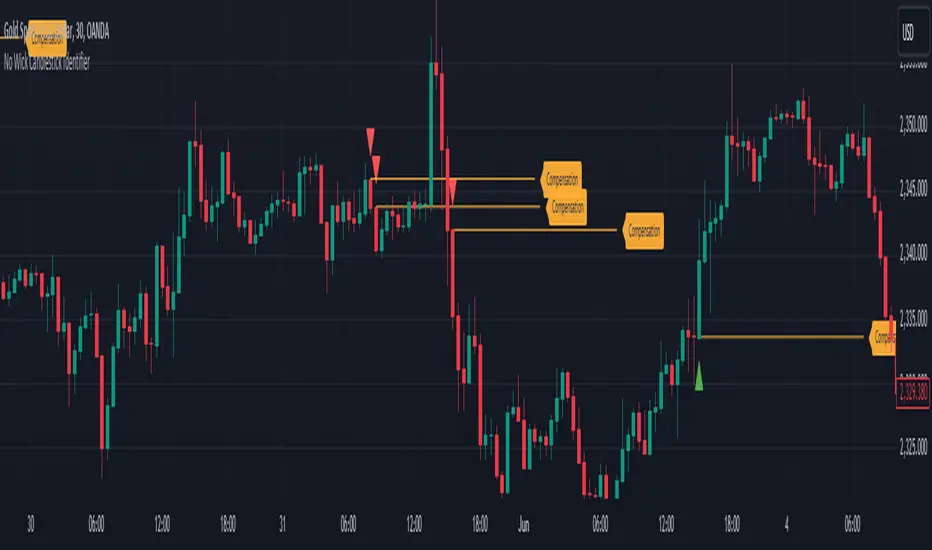
1. Identification of Candlestick Patterns: The script checks each candlestick to determine if it meets the criteria for a "no wick" pattern. For bullish candles, it identifies those with no bottom wick, where the open price is equal to the low and the close price is greater than the open. For bearish candles, it identifies those with no top wick, where the open price is equal to the high and the close price is lower than the open.
2. Visualization: The script plots small triangles on the chart to highlight the identified candlestick patterns. Green triangles are plotted below bullish candles with no bottom wick, while red triangles are plotted above bearish candles with no top wick.
3. Drawing Lines and Labels: Additionally, the script draws lines extending from the opening price of these candles to the right edge of the screen, visually indicating the duration of these patterns. It also adds a label "Compensation" next to each line.
Скрипт с открытым кодом
В истинном духе TradingView, создатель этого скрипта сделал его открытым исходным кодом, чтобы трейдеры могли проверить и убедиться в его функциональности. Браво автору! Вы можете использовать его бесплатно, но помните, что перепубликация кода подчиняется нашим Правилам поведения.
Отказ от ответственности
Информация и публикации не предназначены для предоставления и не являются финансовыми, инвестиционными, торговыми или другими видами советов или рекомендаций, предоставленных или одобренных TradingView. Подробнее читайте в Условиях использования.