OPEN-SOURCE SCRIPT
Finnie's HL BREAKOUT
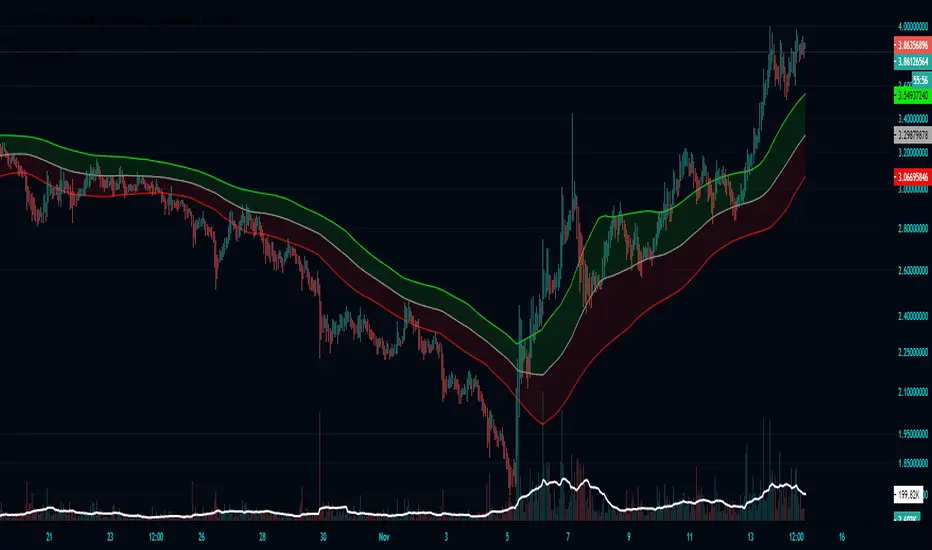
First the indicators takes a range, by default it is 22 candles, then finds the highest and lowest points of said range. At this point your left with lines that follow your support and resistance in the given range (take a look by change the 100 ema in settings to 1). To take things a step further I took a 100 candle ema of the highest highest and lowest lows to not only smooth things out, but also to provide visual ques for breakouts, when closing price is above the top band the asset is considered to be breaking out.
Скрипт с открытым кодом
В истинном духе TradingView, создатель этого скрипта сделал его открытым исходным кодом, чтобы трейдеры могли проверить и убедиться в его функциональности. Браво автору! Вы можете использовать его бесплатно, но помните, что перепубликация кода подчиняется нашим Правилам поведения.
Отказ от ответственности
Информация и публикации не предназначены для предоставления и не являются финансовыми, инвестиционными, торговыми или другими видами советов или рекомендаций, предоставленных или одобренных TradingView. Подробнее читайте в Условиях использования.