PROTECTED SOURCE SCRIPT
[KINGS TREND STRATEGY]
[KINGS TREND STRATEGY] – Kings Trend + Heikin Ashi Dynamic Tool
Category: Trend-Following / Swing Trading
Timeframes: Works on all timeframes (Intraday to Swing)
Markets: Stocks, Futures, Crypto, Forex
What is this Indicator?
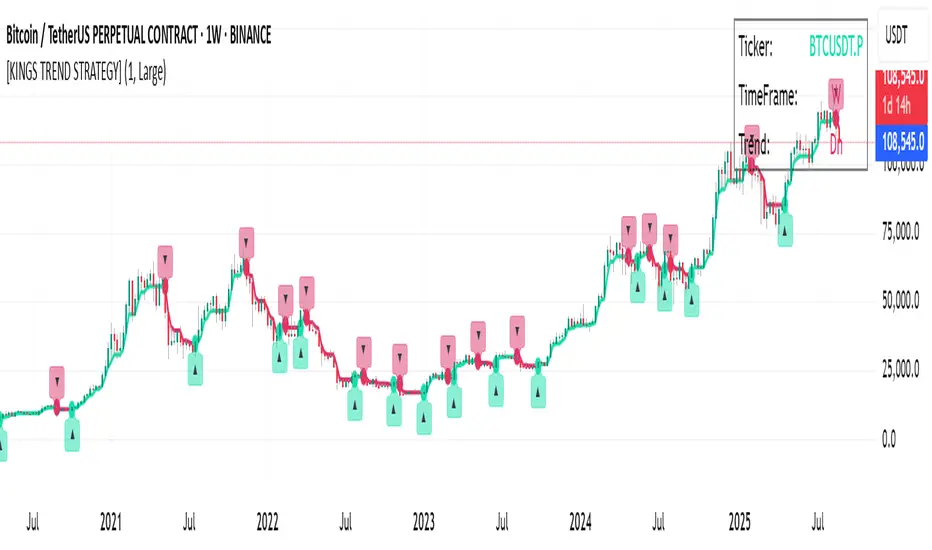
[KINGS TREND STRATEGY] is a trend-following indicator that combines the Half Trend algorithm with optional Heikin Ashi smoothing.
It clearly shows the direction of the trend (Uptrend / Downtrend).
It highlights Buy and Sell signals at high-probability zones.
Optionally, you can color-code the candles based on trend direction.
Key Features
Half Trend Algorithm:
Removes price noise to clearly display the direction of the trend.
Amplitude (sensitivity) can be adjusted manually.
Heikin Ashi Mode (Optional):
Uses Heikin Ashi candles to smooth trend calculations.
Displays Trend Strength (%) to gauge how strong or weak the trend is.
Auto Buy / Sell Signals:
Up (▲) and Down (▼) arrows are plotted whenever a trend reversal occurs.
Signal colors:
#17DFAD (Aqua Green) → Uptrend Signal
#DD326B (Magenta Red) → Downtrend Signal
Dynamic Candle Coloring:
Candles can be colored automatically according to the trend.
In an uptrend, candles appear greenish; in a downtrend, reddish.
On-Chart Dashboard:
Ticker, Timeframe, and Trend Info are displayed live on the chart.
In Heikin Ashi mode, Trend Strength % is also shown.
How to Use
Add to Chart → Select Timeframe → Adjust “Amplitude”:
Low amplitude → more frequent signals (scalping).
High amplitude → fewer but more reliable signals (swing trading).
Watch Buy/Sell Arrows:
▲ Up Arrow: Indicates potential long entry (trend reversal up).
▼ Down Arrow: Indicates potential short entry (trend reversal down).
Optional Enhancements:
Enable trend candles for a cleaner chart view.
Enable Heikin Ashi mode for smoother signals.
Best Practices
Confirm signals using support/resistance levels, volume indicators, or momentum oscillators (RSI / MACD).
Higher timeframes (1H / 4H / 1D) tend to produce more reliable results.
Do not trade solely based on this indicator — risk management is essential.
Disclaimer
This indicator is for educational purposes only.
Past performance does not guarantee future results.
Always use stop-loss and proper risk control when trading.
Category: Trend-Following / Swing Trading
Timeframes: Works on all timeframes (Intraday to Swing)
Markets: Stocks, Futures, Crypto, Forex
What is this Indicator?
[KINGS TREND STRATEGY] is a trend-following indicator that combines the Half Trend algorithm with optional Heikin Ashi smoothing.
It clearly shows the direction of the trend (Uptrend / Downtrend).
It highlights Buy and Sell signals at high-probability zones.
Optionally, you can color-code the candles based on trend direction.
Key Features
Half Trend Algorithm:
Removes price noise to clearly display the direction of the trend.
Amplitude (sensitivity) can be adjusted manually.
Heikin Ashi Mode (Optional):
Uses Heikin Ashi candles to smooth trend calculations.
Displays Trend Strength (%) to gauge how strong or weak the trend is.
Auto Buy / Sell Signals:
Up (▲) and Down (▼) arrows are plotted whenever a trend reversal occurs.
Signal colors:
#17DFAD (Aqua Green) → Uptrend Signal
#DD326B (Magenta Red) → Downtrend Signal
Dynamic Candle Coloring:
Candles can be colored automatically according to the trend.
In an uptrend, candles appear greenish; in a downtrend, reddish.
On-Chart Dashboard:
Ticker, Timeframe, and Trend Info are displayed live on the chart.
In Heikin Ashi mode, Trend Strength % is also shown.
How to Use
Add to Chart → Select Timeframe → Adjust “Amplitude”:
Low amplitude → more frequent signals (scalping).
High amplitude → fewer but more reliable signals (swing trading).
Watch Buy/Sell Arrows:
▲ Up Arrow: Indicates potential long entry (trend reversal up).
▼ Down Arrow: Indicates potential short entry (trend reversal down).
Optional Enhancements:
Enable trend candles for a cleaner chart view.
Enable Heikin Ashi mode for smoother signals.
Best Practices
Confirm signals using support/resistance levels, volume indicators, or momentum oscillators (RSI / MACD).
Higher timeframes (1H / 4H / 1D) tend to produce more reliable results.
Do not trade solely based on this indicator — risk management is essential.
Disclaimer
This indicator is for educational purposes only.
Past performance does not guarantee future results.
Always use stop-loss and proper risk control when trading.
Скрипт с защищённым кодом
Этот скрипт опубликован с закрытым исходным кодом. Однако вы можете использовать его свободно и без каких-либо ограничений — читайте подробнее здесь.
Отказ от ответственности
Все виды контента, которые вы можете увидеть на TradingView, не являются финансовыми, инвестиционными, торговыми или любыми другими рекомендациями. Мы не предоставляем советы по покупке и продаже активов. Подробнее — в Условиях использования TradingView.