OPEN-SOURCE SCRIPT
Daily ATR Tracker
Daily ATR Tracker
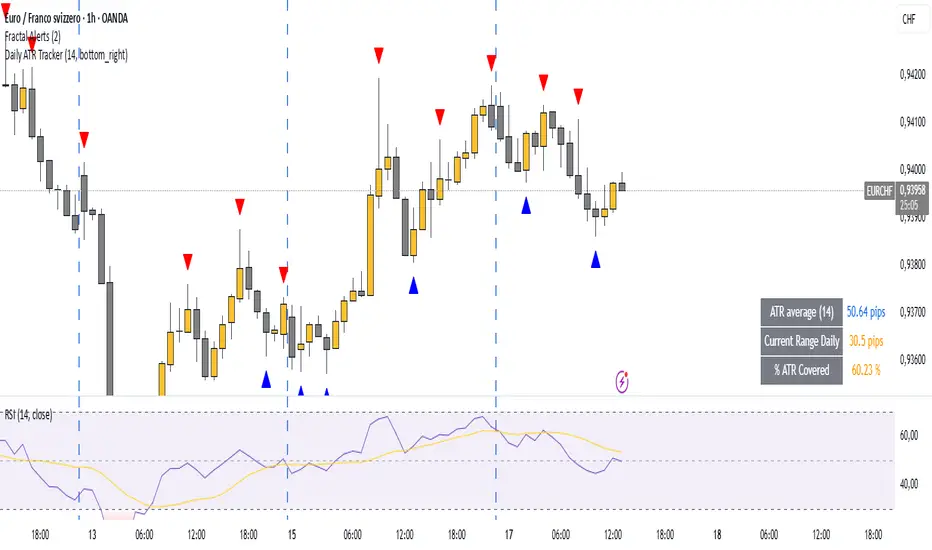
The Daily ATR Tracker is a simple yet powerful tool designed to help traders monitor the daily price movement relative to the average daily range (ATR). This indicator provides an objective view of how much price has moved compared to its recent daily volatility.
🔎 Key Features:
Customizable ATR period (default 14 days)
Live calculation of the current day's price range
ATR value displayed in pips for clear reference
Percentage of ATR covered by the current day's range
Color-coded table for quick visual interpretation:
🟢 Green: less than 60% of ATR covered
🟠 Orange: 60% to 100% of ATR covered
🔴 Red: more than 100% of ATR covered
Alert condition when daily range exceeds 100% of the ATR average
Movable table position to fit your chart layout
🎯 Why use Daily ATR Tracker?
✅ Identify exhaustion zones: When price has already covered a large portion of its typical daily range, the odds of further strong movement may diminish, helping you to manage entries, exits, and risk.
✅ Objective daily bias: Get a quantitative sense of how "stretched" the market is in real time.
✅ Works with any timeframe: While designed for daily ranges, you can monitor intraday movements with this context in mind.
⚠️ Usage Note:
This tool does not provide buy or sell signals by itself. It is designed to complement your existing strategies by offering additional context regarding daily range exhaustion.
Скрипт с открытым кодом
В истинном духе TradingView, создатель этого скрипта сделал его открытым исходным кодом, чтобы трейдеры могли проверить и убедиться в его функциональности. Браво автору! Вы можете использовать его бесплатно, но помните, что перепубликация кода подчиняется нашим Правилам поведения.
Отказ от ответственности
Информация и публикации не предназначены для предоставления и не являются финансовыми, инвестиционными, торговыми или другими видами советов или рекомендаций, предоставленных или одобренных TradingView. Подробнее читайте в Условиях использования.