OPEN-SOURCE SCRIPT
Moving Average Deviations

Inputs:
MA Length = select the length period of the moving average
Timeframe = select the timeframe you want the indicator to operate on
Moving Average Type = select the type of moving average you want to use- most common ones are listed
Lookback = The histogram comparison period. A longer lookback will give fewer signals.
"Compare this reading to the past [Lookback #] of readings"
Threshold = The percent change in reading required compared to the lookback period to paint a bar dark red or dark green. A smaller threshold gives fewer readings.
"Compare this reading and only look for the top [Threshold %] of moves"
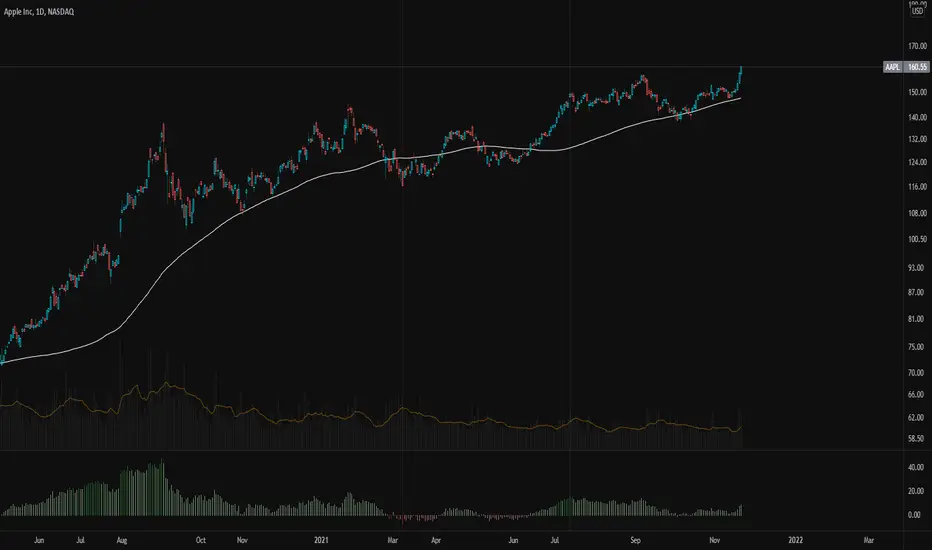
This moving average creates a histogram plot of the percent deviation from a specified moving average. Above paints faint green, and below paints faint red.
Dark red/green are painted in the direction of the move when the move is above the Threshold % when compared to the past Lookback length.
This script is optimally used to countertrend. It paints a good place to buy the dip or sell the rip given extensions-- different variant of overbought/oversold.
In this example, I used the 100 SMA, 100 period lookback, and a threshold of 7% [Default].
Скрипт с открытым кодом
В истинном духе TradingView, создатель этого скрипта сделал его открытым исходным кодом, чтобы трейдеры могли проверить и убедиться в его функциональности. Браво автору! Вы можете использовать его бесплатно, но помните, что перепубликация кода подчиняется нашим Правилам поведения.
Отказ от ответственности
Информация и публикации не предназначены для предоставления и не являются финансовыми, инвестиционными, торговыми или другими видами советов или рекомендаций, предоставленных или одобренных TradingView. Подробнее читайте в Условиях использования.