OPEN-SOURCE SCRIPT
AT Ratio
AT Ratio
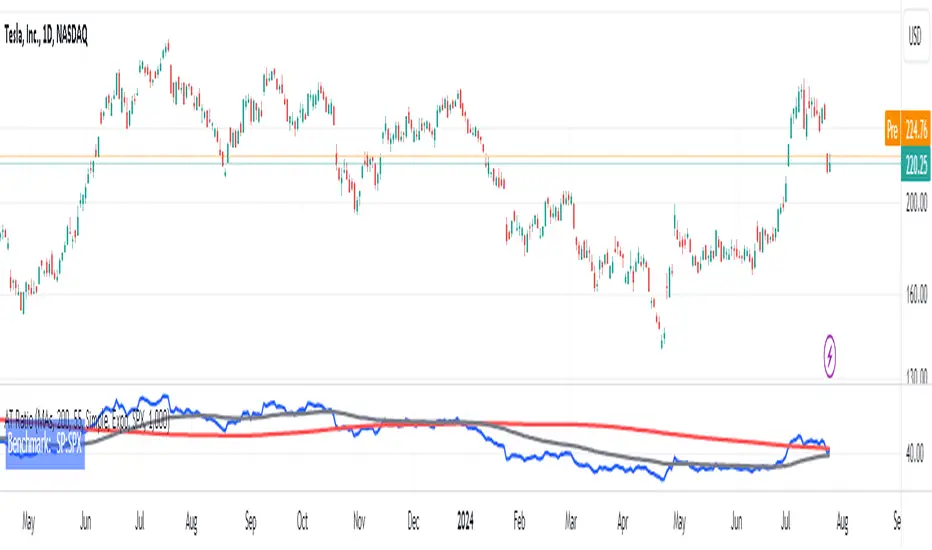
This indicator plots a ratio chart of 2 symbols, calculated as symbol1/symbol2.
The current chart symbol is used as symbol1.
A ratio chart allows to determine the relative strength of an asset compared to another asset.
It can be used for example to compare two stocks or a stock to its benchmark index, thus showing,
- if a stock has strength on its own (climbing ratio chart)
- if a stock just moves with the index (sideways ratio chart)
- if a stock is weaker than the index (falling ratio chart)
Inputs:
Style:
Plain: Only the ratio chart is plotted
MAs: Additional Moving Averages of the ratio chart are plotted
Perdiod Long: The period for the long MA
Perdiod Short: The period for the long MA
MA Type Long:
Simple: A simple MA is used
Expo: An exponential MA is used
MA Type Short:
Simple: A simple MA is used
Expo: An exponential MA is used
Ratio Symbol: The symbol to be used for symbol2
Factor: A factor the ratio value is multiplied by
Open-source script
Скрипт с открытым кодом
В истинном духе TradingView, создатель этого скрипта сделал его открытым исходным кодом, чтобы трейдеры могли проверить и убедиться в его функциональности. Браво автору! Вы можете использовать его бесплатно, но помните, что перепубликация кода подчиняется нашим Правилам поведения.
Отказ от ответственности
Информация и публикации не предназначены для предоставления и не являются финансовыми, инвестиционными, торговыми или другими видами советов или рекомендаций, предоставленных или одобренных TradingView. Подробнее читайте в Условиях использования.