PROTECTED SOURCE SCRIPT
Обновлено Best Range (Day Trading)

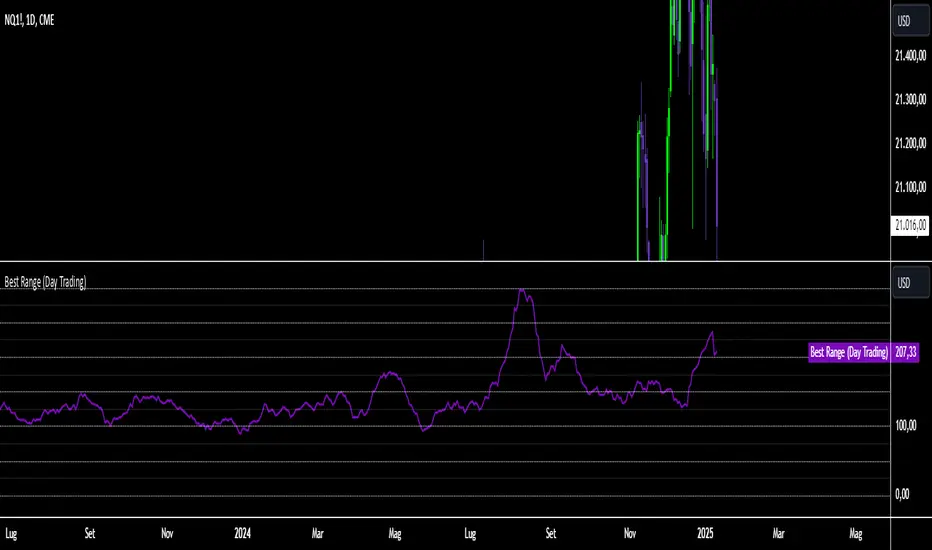
The indicator is based on a formula very similar to that of the ATR. The average volatility of the last candles (a value adjustable via inputs) is calculated, and this value is then divided (a value adjustable via inputs), providing a specific value in terms of RANGE.
Its use is very straightforward. It was primarily designed for stock indices (Nasdaq & SPX). When used on the DAILY timeframe, it provides the recommended RANGE value for day trading with structural logic.
Its goal is to offer a guiding value for setting the chart to a range-based view that is optimal and as effective as possible in identifying breakouts of specific levels, helping traders avoid false breakouts or misleading structures.
We can also observe a division of levels into quartiles (25, 50, 75, 100, 125...). This helps provide reference ranges, allowing the range to be used with rounded numbers.
For example, on Nasdaq, if the indicator set on DAILY provides a value between 200 and 250, then it is advisable to visualize the chart at 200 RANGE for a more aggressive approach or at 250 RANGE for a more conservative approach.
On SPX, which is less volatile, we use increments of 25. If the indicator gives a value between 25 and 50, then we use 25 for an aggressive approach and 50 for a conservative approach.
Obviously, this refers to FUTURES and the tick movements of MINI contracts.
Информация о релизе
NEW VERSION The indicator is based on a formula very similar to that of the ATR. The average volatility of the last candles (a value adjustable via inputs) is calculated, and this value is then divided (a value adjustable via inputs), providing a specific value in terms of RANGE.
Its use is very straightforward. It was primarily designed for stock indices (Nasdaq & SPX). When used on the DAILY timeframe, it provides the recommended RANGE value for day trading with structural logic.
Its goal is to offer a guiding value for setting the chart to a range-based view that is optimal and as effective as possible in identifying breakouts of specific levels, helping traders avoid false breakouts or misleading structures.
We can also observe a division of levels into quartiles (25, 50, 75, 100, 125...). This helps provide reference ranges, allowing the range to be used with rounded numbers.
For example, on Nasdaq, if the indicator set on DAILY provides a value between 200 and 250, then it is advisable to visualize the chart at 200 RANGE for a more aggressive approach or at 250 RANGE for a more conservative approach.
On SPX, which is less volatile, we use increments of 25. If the indicator gives a value between 25 and 50, then we use 25 for an aggressive approach and 50 for a conservative approach.
Obviously, this refers to FUTURES and the tick movements of MINI contracts.
Скрипт с защищённым кодом
Этот скрипт опубликован с закрытым исходным кодом. Однако вы можете использовать его свободно и без каких-либо ограничений — читайте подробнее здесь.
Отказ от ответственности
Информация и публикации не предназначены для предоставления и не являются финансовыми, инвестиционными, торговыми или другими видами советов или рекомендаций, предоставленных или одобренных TradingView. Подробнее читайте в Условиях использования.