OPEN-SOURCE SCRIPT
PA ScratchiCloud
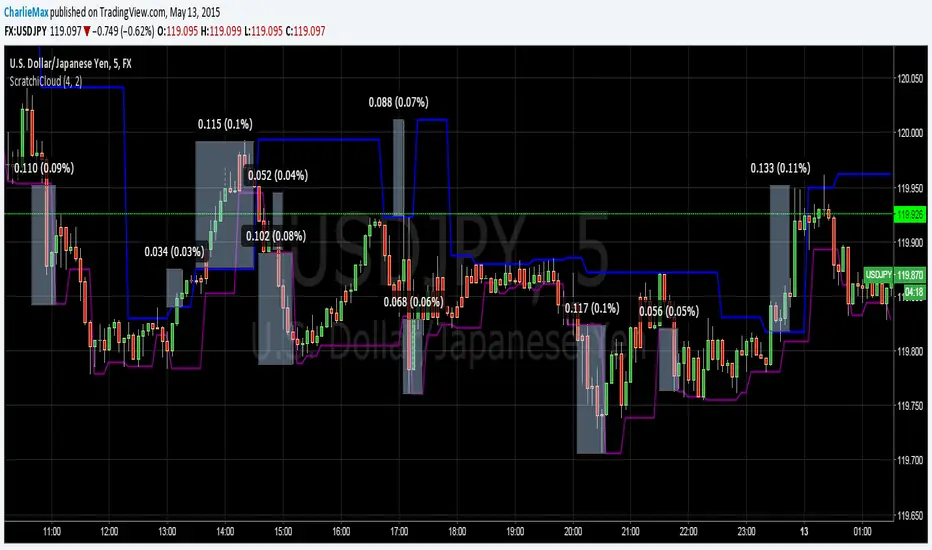
This indicator is a modification of Golgistain's Hi/Lo Pivot indicator. I added a shorter length 2 to get early entries on short positions.
The way it works is you choose a timeframe you would like to trade and then set the indicator length to match the candle price action patterns. Default is M5 chart with 4/2 for the indicators.
Rules: Take the trade when price breaks out the top or bottom of the line.
Exit: Take what you can get and give nothing back.
Good luck - CharlieMax :0)
Скрипт с открытым кодом
В истинном духе TradingView, создатель этого скрипта сделал его открытым исходным кодом, чтобы трейдеры могли проверить и убедиться в его функциональности. Браво автору! Вы можете использовать его бесплатно, но помните, что перепубликация кода подчиняется нашим Правилам поведения.
Отказ от ответственности
Информация и публикации не предназначены для предоставления и не являются финансовыми, инвестиционными, торговыми или другими видами советов или рекомендаций, предоставленных или одобренных TradingView. Подробнее читайте в Условиях использования.