OPEN-SOURCE SCRIPT
Обновлено Composite Z-Score with Linear Regression Bands [UAlgo]
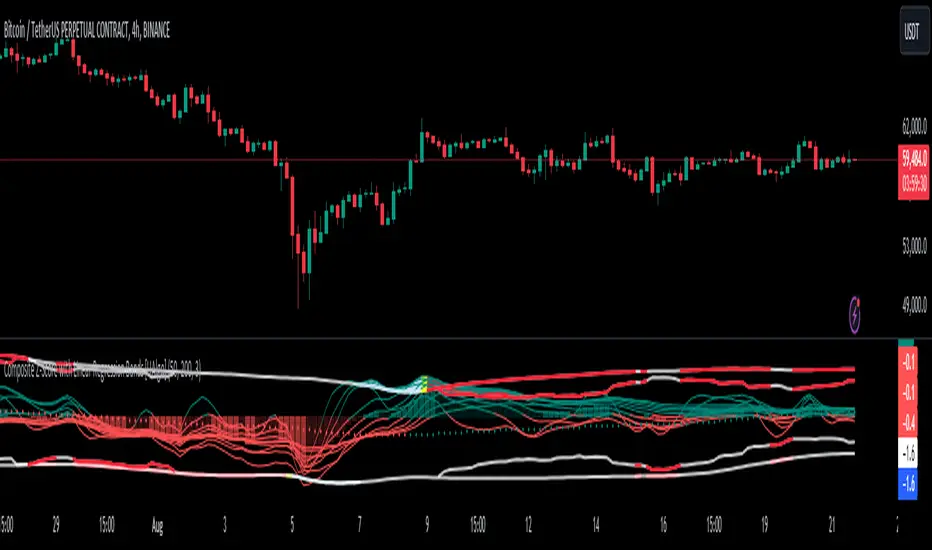
The Composite Z-Score with Linear Regression Bands [UAlgo] is a technical indicator designed to provide traders with a comprehensive analysis of price momentum, volatility, and volume. By combining multiple moving averages with slope analysis, volume/volatility compression-expansion metrics, and Z-Score calculations, this indicator aims to highlight potential breakout and breakdown points with high accuracy. The inclusion of linear regression bands further enhances the analysis by providing dynamic support and resistance levels, which adapt to market conditions. This makes the indicator particularly useful in identifying overbought/oversold conditions, volume squeezes, and the overall direction of the trend.

🔶 Key Features
Multi-Length Slope Calculation: The indicator uses multiple Hull Moving Averages (HMA) across various lengths to calculate slope angles, which are then converted into Z-Scores. This helps in capturing both short-term and long-term price momentum.
Volume/Volatility Composite Analysis: By calculating a composite value derived from both volume and volatility, the indicator identifies periods of compression (squeezes) and expansion, which are crucial for detecting potential breakout opportunities.
Linear Regression Bands: The inclusion of dynamic linear regression bands provides traders with adaptive support and resistance levels. These bands are enhanced by the composite value, which adjusts the band width based on market conditions, offering a clearer view of possible price reversals.
Overbought/Oversold Detection: The indicator highlights overbought and oversold conditions by comparing Z-Scores against the upper and lower bounds of the regression bands, which can signal potential reversal points.
Customizable Inputs: Users can customize key parameters such as the lengths of the moving averages, the regression band period, and the number of deviations used for the bands, allowing for flexibility in adapting the indicator to different market environments.
🔶 Interpreting the Indicator
Z-Score Plots: The individual Z-Score plots represent the normalized slope of the Hull Moving Averages over different periods. Positive values indicate upward momentum, while negative values suggest downward momentum. The combined Z-Sum provides a broader view of the overall market momentum.
Composite Value: The composite value is a ratio of volume to volatility, which highlights periods of market compression and expansion. When the composite value rises, it suggests increasing market activity, often preceding a breakout.
Why are we calculating values for multiple lengths?
The Composite Z-Score with Linear Regression Bands indicator employs a multi-timeframe analysis by calculating Z-scores for various moving average lengths. This approach provides a more comprehensive view of market dynamics and helps to identify trends and potential reversals across different timeframes. By considering multiple lengths, we can:
Capture a broader range of market behaviors: Different moving average lengths capture different aspects of price movement. Shorter lengths are more sensitive to recent price changes, while longer lengths provide a smoother representation of the underlying trend.
Reduce the impact of noise: By combining Z-scores from multiple lengths, we can help to filter out some of the noise that can be present in shorter-term data and obtain a more robust signal.
Enhance the reliability of signals: When Z-scores from multiple lengths align, it can increase the confidence in the identified trend or potential reversal. This can help to reduce the likelihood of false signals.
In essence, calculating values for multiple lengths allows the indicator to provide a more nuanced and reliable assessment of market conditions, making it a valuable tool for traders and analysts.
Linear Regression Bands: The central line represents the linear regression of the Z-Sum, while the upper and lower bands represent the dynamic resistance and support levels, respectively. The deviation from the regression line indicates the strength of the current trend. When price moves beyond these bands, it may signal an overbought (above upper band) or oversold (below lower band) condition.
Volume/Volatility Squeeze: When the price moves between the regression bands and the volume/volatility-adjusted bands, the market is in a squeeze. Breakouts from this squeeze can lead to significant price moves, which are indicated by the filling of areas between the Z-Score plots and the bands.


Color Interpretation: The indicator uses color changes to make it easier to interpret the data. Teal colors generally indicate upward momentum or strong conditions, while red suggests downward momentum or weakening conditions. The intensity of the color reflects the strength of the signal.
Overbought/Oversold Signals: The indicator marks potential overbought and oversold conditions when Z-Scores cross above or below the upper and lower regression bands, respectively. These signals are crucial for identifying potential reversal points in the market.

🔶 Disclaimer
Use with Caution: This indicator is provided for educational and informational purposes only and should not be considered as financial advice. Users should exercise caution and perform their own analysis before making trading decisions based on the indicator's signals.
Not Financial Advice: The information provided by this indicator does not constitute financial advice, and the creator (UAlgo) shall not be held responsible for any trading losses incurred as a result of using this indicator.
Backtesting Recommended: Traders are encouraged to backtest the indicator thoroughly on historical data before using it in live trading to assess its performance and suitability for their trading strategies.
Risk Management: Trading involves inherent risks, and users should implement proper risk management strategies, including but not limited to stop-loss orders and position sizing, to mitigate potential losses.
No Guarantees: The accuracy and reliability of the indicator's signals cannot be guaranteed, as they are based on historical price data and past performance may not be indicative of future results.
🔶 Key Features
Multi-Length Slope Calculation: The indicator uses multiple Hull Moving Averages (HMA) across various lengths to calculate slope angles, which are then converted into Z-Scores. This helps in capturing both short-term and long-term price momentum.
Volume/Volatility Composite Analysis: By calculating a composite value derived from both volume and volatility, the indicator identifies periods of compression (squeezes) and expansion, which are crucial for detecting potential breakout opportunities.
Linear Regression Bands: The inclusion of dynamic linear regression bands provides traders with adaptive support and resistance levels. These bands are enhanced by the composite value, which adjusts the band width based on market conditions, offering a clearer view of possible price reversals.
Overbought/Oversold Detection: The indicator highlights overbought and oversold conditions by comparing Z-Scores against the upper and lower bounds of the regression bands, which can signal potential reversal points.
Customizable Inputs: Users can customize key parameters such as the lengths of the moving averages, the regression band period, and the number of deviations used for the bands, allowing for flexibility in adapting the indicator to different market environments.
🔶 Interpreting the Indicator
Z-Score Plots: The individual Z-Score plots represent the normalized slope of the Hull Moving Averages over different periods. Positive values indicate upward momentum, while negative values suggest downward momentum. The combined Z-Sum provides a broader view of the overall market momentum.
Composite Value: The composite value is a ratio of volume to volatility, which highlights periods of market compression and expansion. When the composite value rises, it suggests increasing market activity, often preceding a breakout.
Why are we calculating values for multiple lengths?
The Composite Z-Score with Linear Regression Bands indicator employs a multi-timeframe analysis by calculating Z-scores for various moving average lengths. This approach provides a more comprehensive view of market dynamics and helps to identify trends and potential reversals across different timeframes. By considering multiple lengths, we can:
Capture a broader range of market behaviors: Different moving average lengths capture different aspects of price movement. Shorter lengths are more sensitive to recent price changes, while longer lengths provide a smoother representation of the underlying trend.
Reduce the impact of noise: By combining Z-scores from multiple lengths, we can help to filter out some of the noise that can be present in shorter-term data and obtain a more robust signal.
Enhance the reliability of signals: When Z-scores from multiple lengths align, it can increase the confidence in the identified trend or potential reversal. This can help to reduce the likelihood of false signals.
In essence, calculating values for multiple lengths allows the indicator to provide a more nuanced and reliable assessment of market conditions, making it a valuable tool for traders and analysts.
Linear Regression Bands: The central line represents the linear regression of the Z-Sum, while the upper and lower bands represent the dynamic resistance and support levels, respectively. The deviation from the regression line indicates the strength of the current trend. When price moves beyond these bands, it may signal an overbought (above upper band) or oversold (below lower band) condition.
Volume/Volatility Squeeze: When the price moves between the regression bands and the volume/volatility-adjusted bands, the market is in a squeeze. Breakouts from this squeeze can lead to significant price moves, which are indicated by the filling of areas between the Z-Score plots and the bands.
Color Interpretation: The indicator uses color changes to make it easier to interpret the data. Teal colors generally indicate upward momentum or strong conditions, while red suggests downward momentum or weakening conditions. The intensity of the color reflects the strength of the signal.
Overbought/Oversold Signals: The indicator marks potential overbought and oversold conditions when Z-Scores cross above or below the upper and lower regression bands, respectively. These signals are crucial for identifying potential reversal points in the market.
🔶 Disclaimer
Use with Caution: This indicator is provided for educational and informational purposes only and should not be considered as financial advice. Users should exercise caution and perform their own analysis before making trading decisions based on the indicator's signals.
Not Financial Advice: The information provided by this indicator does not constitute financial advice, and the creator (UAlgo) shall not be held responsible for any trading losses incurred as a result of using this indicator.
Backtesting Recommended: Traders are encouraged to backtest the indicator thoroughly on historical data before using it in live trading to assess its performance and suitability for their trading strategies.
Risk Management: Trading involves inherent risks, and users should implement proper risk management strategies, including but not limited to stop-loss orders and position sizing, to mitigate potential losses.
No Guarantees: The accuracy and reliability of the indicator's signals cannot be guaranteed, as they are based on historical price data and past performance may not be indicative of future results.
Информация о релизе
Pinescript version update.Скрипт с открытым кодом
В истинном духе TradingView, создатель этого скрипта сделал его открытым исходным кодом, чтобы трейдеры могли проверить и убедиться в его функциональности. Браво автору! Вы можете использовать его бесплатно, но помните, что перепубликация кода подчиняется нашим Правилам поведения.
Отказ от ответственности
Информация и публикации не предназначены для предоставления и не являются финансовыми, инвестиционными, торговыми или другими видами советов или рекомендаций, предоставленных или одобренных TradingView. Подробнее читайте в Условиях использования.
Скрипт с открытым кодом
В истинном духе TradingView, создатель этого скрипта сделал его открытым исходным кодом, чтобы трейдеры могли проверить и убедиться в его функциональности. Браво автору! Вы можете использовать его бесплатно, но помните, что перепубликация кода подчиняется нашим Правилам поведения.
Отказ от ответственности
Информация и публикации не предназначены для предоставления и не являются финансовыми, инвестиционными, торговыми или другими видами советов или рекомендаций, предоставленных или одобренных TradingView. Подробнее читайте в Условиях использования.