OPEN-SOURCE SCRIPT
Relative Price Oscillator
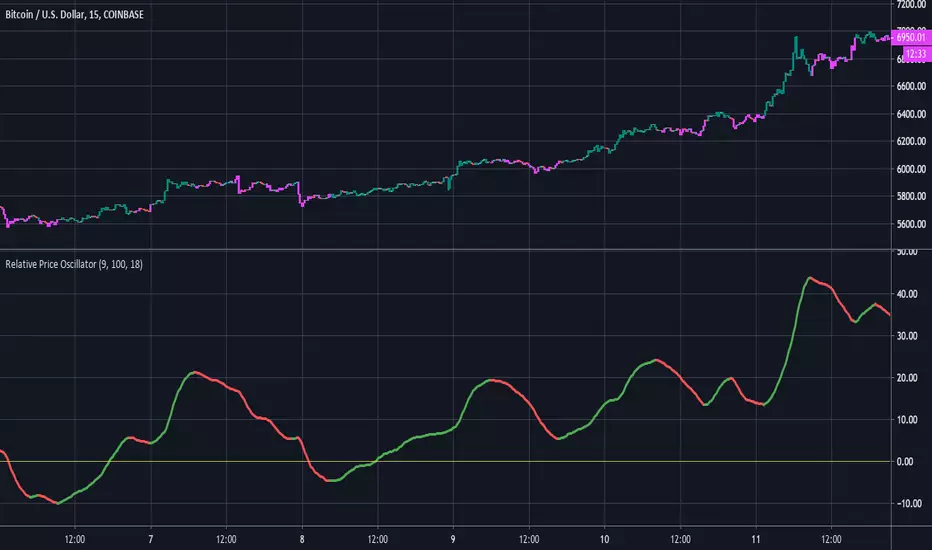
Here is a new experimental indicator we've been working on. The idea was to compare two EMA's of period midpoints to the actual closing price. The steps that were taken are listed below:
1.Calculate an EMA based on each period's midpoint ((High * Low) /2) for the last 9 periods.
2.Calculate an EMA based on each period's midpoint for the last 100 periods.
3. Divide the difference of the two EMA's by the closing price. ((EMA1 - EMA2) / Close).
4. Smooth the value from step #3 with an 18 period EMA. Multiply by 1000 for better scaling/visibility.
Using:
Bullish when line is green, bearish when line is red. Buy on first green, then sell on first red.
There is also an option to color the candles based on the RPO line.
Скрипт с открытым кодом
В истинном духе TradingView, создатель этого скрипта сделал его открытым исходным кодом, чтобы трейдеры могли проверить и убедиться в его функциональности. Браво автору! Вы можете использовать его бесплатно, но помните, что перепубликация кода подчиняется нашим Правилам поведения.
-Profit Programmers
profitprogrammer.com
profitprogrammer.com
Отказ от ответственности
Информация и публикации не предназначены для предоставления и не являются финансовыми, инвестиционными, торговыми или другими видами советов или рекомендаций, предоставленных или одобренных TradingView. Подробнее читайте в Условиях использования.