OPEN-SOURCE SCRIPT
Обновлено Comparative Relative Strength of a stock
Perform comparative relative strength of a stock. Default base is NIFTY 50.
Информация о релизе
Cosmetic changes to make the display pretty and input choices in more logical sequence.Информация о релизе
Added input as source. Some cosmetic changes.Информация о релизе
- version 5
- Added color code for CRS moving average
A color-based trend on the Ratio moving average. The trend lookback is configurable.
Информация о релизе
- Possible to plot candles, of ratio chart, instead of line chart only.
Информация о релизе
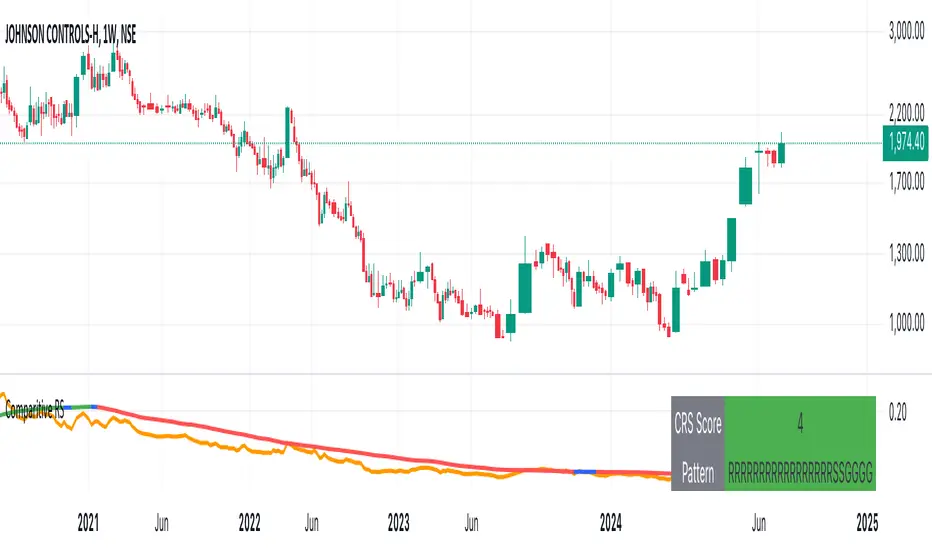
Updated to include a "CRS Score" and "CRS Pattern"- CRS Score: The number of consecutive bars, when the trend of the relative strength is increasing/decreasing. If CRS is falling, score will be negative, if rising, score will be positive and 0 if it is neither positive nor negative (blue)
- CRS Pattern: The pattern of the last 23 (default) bars for the CRS Trend.
If say, the CRS Pattern is RRRRRRRRRSSGG - It means that after 11 bars, the strength is now positive for last 2 bars. This is a good way to visualise a turn around in relative strength of the stock. Higher the number of opposite trend the greater that chance of the reversal.
Скрипт с открытым кодом
В истинном духе TradingView, создатель этого скрипта сделал его открытым исходным кодом, чтобы трейдеры могли проверить и убедиться в его функциональности. Браво автору! Вы можете использовать его бесплатно, но помните, что перепубликация кода подчиняется нашим Правилам поведения.
Отказ от ответственности
Информация и публикации не предназначены для предоставления и не являются финансовыми, инвестиционными, торговыми или другими видами советов или рекомендаций, предоставленных или одобренных TradingView. Подробнее читайте в Условиях использования.