ElectronixTrader - Multi-Timeframe S/R
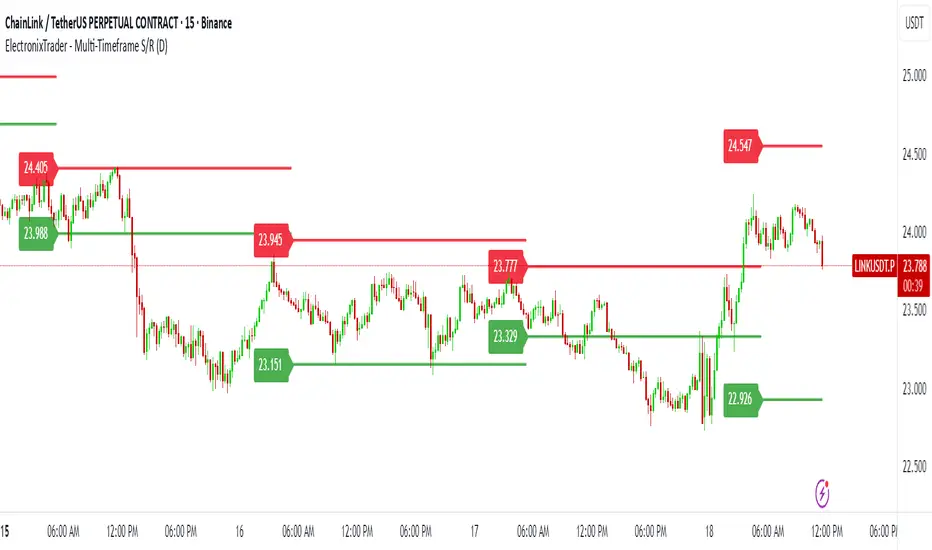
The core principle is that significant price levels established on a daily or weekly chart can act as powerful support and resistance points on a lower, intraday timeframe. This helps traders align their entries and exits with the broader market context.
Key Features:
Dynamic Levels: The support and resistance lines are not static. They are automatically calculated and updated at the start of each new higher-timeframe candle, providing fresh and relevant levels.
Multi-Timeframe Capability: Easily switch the input timeframe (e.g., Daily to Weekly) to adapt the indicator for your trading style, from intraday to swing trading.
Disclaimer:
Trading involves significant risk, and past performance is not a guarantee of future results. This tool is for informational and educational purposes only and should be used in conjunction with your own risk management and trading plan.
A Note on Originality:
This indicator uses a unique application of built-in functions to project dynamic, higher-timeframe levels. While it is based on classic concepts, the specific methodology of projecting and consistently plotting these zones across different timeframes provides a unique and actionable tool for traders.
Скрипт с ограниченным доступом
Доступ к этому скрипту имеют только пользователи, одобренные автором. Вам необходимо запросить и получить разрешение на его использование. Обычно оно предоставляется после оплаты. Для получения подробной информации следуйте инструкциям автора ниже или свяжитесь напрямую с ElectronixTrader.
TradingView НЕ рекомендует оплачивать или использовать скрипт, если вы полностью не доверяете его автору и не понимаете, как он работает. Вы также можете найти бесплатные, открытые альтернативы в наших скриптах сообщества.
Инструкции от автора
Отказ от ответственности
Скрипт с ограниченным доступом
Доступ к этому скрипту имеют только пользователи, одобренные автором. Вам необходимо запросить и получить разрешение на его использование. Обычно оно предоставляется после оплаты. Для получения подробной информации следуйте инструкциям автора ниже или свяжитесь напрямую с ElectronixTrader.
TradingView НЕ рекомендует оплачивать или использовать скрипт, если вы полностью не доверяете его автору и не понимаете, как он работает. Вы также можете найти бесплатные, открытые альтернативы в наших скриптах сообщества.