OPEN-SOURCE SCRIPT
Обновлено SuperTrend Bar Counter - DolphinTradeBot
- OVERVIEW
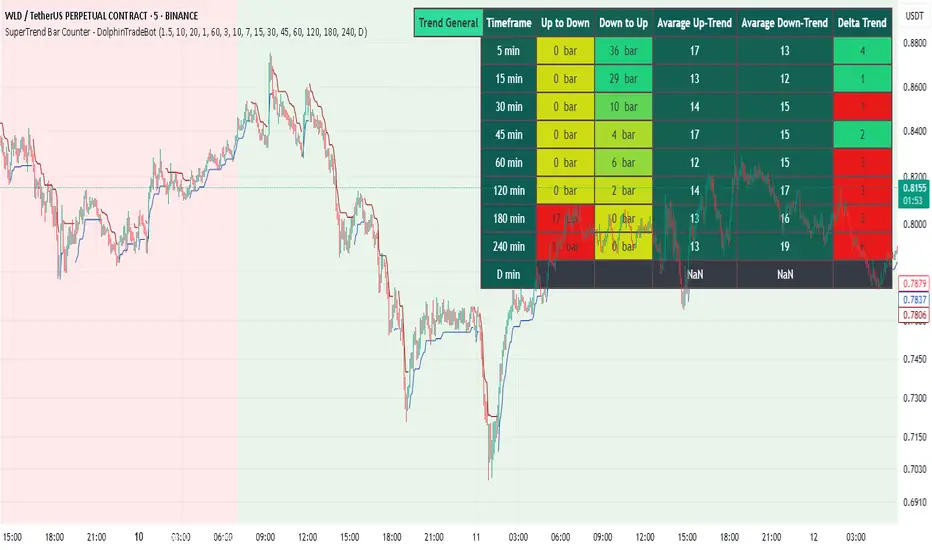
This indicator calculates the lengths of upward and downward trends based on the specified SuperTrend settings and timeframe. It then takes the average length of the entered number of swings and compares the current trend durations with these averages. The main goal is to anticipate potential reversals in advance. - HOW IS IT WORK ? The indicator actually contains two different but conceptually similar metrics.
- The first part; shows how long the Supertrend stays in an upward or downward trend in real time. Additionally, it analyzes how close the current value is to the average of the Supertrend bar count for the given input.
- The second part; aims to provide a different perspective on general trend analysis. It calculates the average duration of upward and downward trends in bars based on the SuperTrend indicator settings within a specified period and timeframe. If, contrary to expectations, downward trends last longer than upward trends, the background is colored green, indicating a prediction that the trend will continue upward.
- Explanation of the second part logic: As you know, moving averages or similar approaches that follow the price are often correct when looking back retrospectively, but they cannot serve as leading indicators in real-time trading.That's why, when performing trend analysis, I wanted to introduce a completely different perspective based on price movement, yet still grounded in price action itself.
This phenomenon is partly due to the nature of the SuperTrend itself. After strong price movements, SuperTrend tends to reverse direction much more quickly during pullbacks. Following a strong upward move, a downward trend is detected much earlier and tends to last longer. The indicator provides an alternative perspective by analyzing which directional movement occurs more rapidly and uses this insight for trend prediction.
- Explanation of the second part logic: As you know, moving averages or similar approaches that follow the price are often correct when looking back retrospectively, but they cannot serve as leading indicators in real-time trading.That's why, when performing trend analysis, I wanted to introduce a completely different perspective based on price movement, yet still grounded in price action itself.
- The first part; shows how long the Supertrend stays in an upward or downward trend in real time. Additionally, it analyzes how close the current value is to the average of the Supertrend bar count for the given input.
- HOW TO USE ?
It can be used to identify potential price reversals or to assess whether the price is generally cheap or expensive.
In the settings section, you can adjust the SuperTrend parameters and timeframes for the values displayed in the table.
In the second part, you can configure the values used for general trend analysis.
- NOTE
Things to be aware of: As the chart's timeframe decreases, pulling data from higher timeframes becomes more difficult. For example, when the chart is set to a 5-minute timeframe, it may fail to retrieve swing periods from the daily timeframe. Similarly, on a 4-hour chart, when calculating the average swing, there might be enough data for only 5 periods instead of 20.
Please keep in mind that this indicator was created solely to provide an idea. It should only be considered as a perspective or a supporting tool that influences your decision by no more than 5% at most.
Информация о релизе
Due to the potential for repainting, barmerge.lookahead_on was changed to barmerge.lookahead_off.Скрипт с открытым кодом
В истинном духе TradingView, создатель этого скрипта сделал его открытым исходным кодом, чтобы трейдеры могли проверить и убедиться в его функциональности. Браво автору! Вы можете использовать его бесплатно, но помните, что перепубликация кода подчиняется нашим Правилам поведения.
Отказ от ответственности
Информация и публикации не предназначены для предоставления и не являются финансовыми, инвестиционными, торговыми или другими видами советов или рекомендаций, предоставленных или одобренных TradingView. Подробнее читайте в Условиях использования.
Скрипт с открытым кодом
В истинном духе TradingView, создатель этого скрипта сделал его открытым исходным кодом, чтобы трейдеры могли проверить и убедиться в его функциональности. Браво автору! Вы можете использовать его бесплатно, но помните, что перепубликация кода подчиняется нашим Правилам поведения.
Отказ от ответственности
Информация и публикации не предназначены для предоставления и не являются финансовыми, инвестиционными, торговыми или другими видами советов или рекомендаций, предоставленных или одобренных TradingView. Подробнее читайте в Условиях использования.