OPEN-SOURCE SCRIPT
Yearly High/Low Indicator
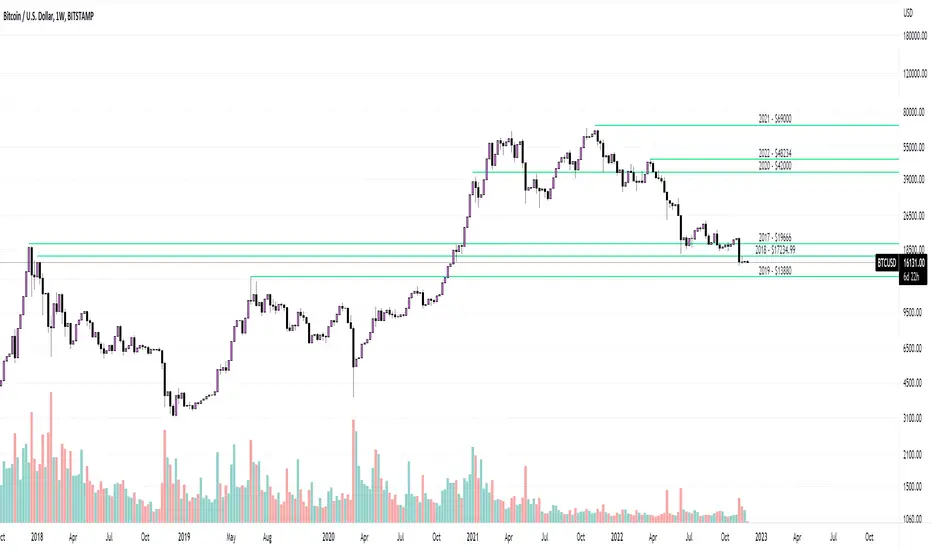
This is a basic line drawing script which will draw lines for the highest and lowest prices for each year on a chart. High lines will be green and low lines will be red. Each line is labeled with the year and price that it represents. It takes in a single input value which is the year to start marking from. By default, the script will only draw the yearly high lines and a check-box can be selected to enable the low lines. The high line can, similarly, be disable should you only want the low lines. I chose this default because I noticed that more often than not, with both enabled, the screen got a little too cluttered.
Known Issues:
If you set the starting year to the current year, the labels don't show up. I spent a while trying to figure out why but I gave up after realizing that if you only have one year selected, it's less important that they be labeled and it didn't bother me after that. If it bothers you, fix it and feel free to let me know how you did it but I'm not interested in working any harder on a fix right now.
Скрипт с открытым кодом
В истинном духе TradingView автор этого скрипта опубликовал его с открытым исходным кодом, чтобы трейдеры могли понять, как он работает, и проверить на практике. Вы можете воспользоваться им бесплатно, но повторное использование этого кода в публикации регулируется Правилами поведения. Вы можете добавить этот скрипт в избранное и использовать его на графике.
Хотите использовать этот скрипт на графике?
Отказ от ответственности
Все виды контента, которые вы можете увидеть на TradingView, не являются финансовыми, инвестиционными, торговыми или любыми другими рекомендациями. Мы не предоставляем советы по покупке и продаже активов. Подробнее — в Условиях использования TradingView.