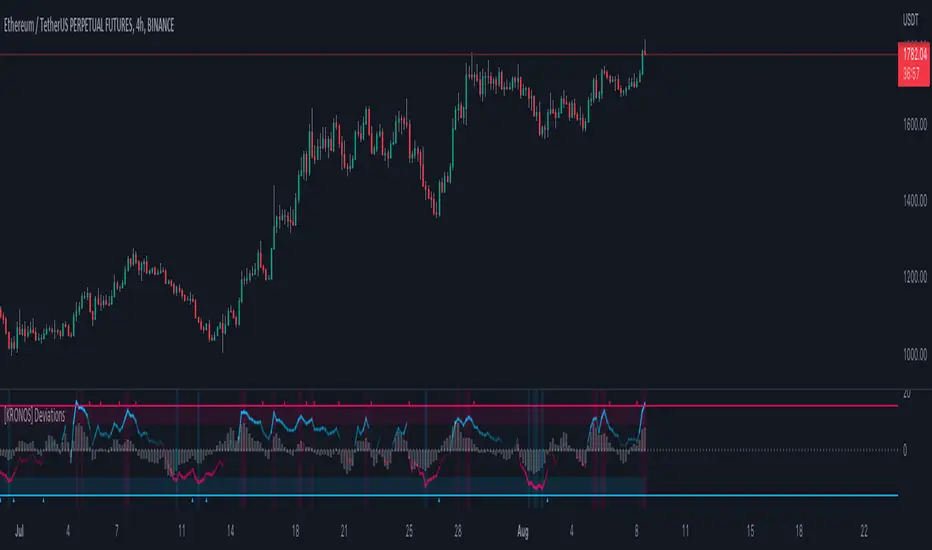
[KRONOS] Deviations
This indicator calculates the differences between the current price and the local support or resistance, and normalizes it into a range.
The value basis is calculated from a defined period of time that is then multiplied to get a standard deviations and a max. and min. value subtracted and divided into a final value.
It includes
Extreme zones. This value appears as blue and red lines which deviates from the oversold to overbought range.
Momentum. Lower time frame momentum is represented by a gray histogram as well as a signal line oscillating from a red to blue color.
Strong reversal. Red ( bearish ) and blue ( bullish ) columns will appear on the histogram when our algorithm detects that the strength of momentum is coming to an end indicative of a trend reversal.
Trend confirmation. Red or blue arrows will act as a trend confirmation.
Support and resistance . The zero line will frequently serve as a S/R area.
Divergences. You can use this indicator to detect potential pivot areas.
How to use?
Sell/Short when the histogram shows a red column and the signal line is in or above the overbought area (colored in red).
Buy/Long when the histogram shows a blue column and the signal line is in or below the oversold area (colored in blue).
extra tip: if you entered a trade based on the above conditions, you can partially increase your position each time you see a confirmation arrow.
Скрипт с ограниченным доступом
Только пользователи, одобренные автором, могут получить доступ к этому скрипту. Вам нужно отправить запрос и получить разрешение на его использование. Обычно доступ предоставляется после оплаты. Для получения подробной информации следуйте инструкциям автора ниже или свяжитесь с kronos-algo напрямую.
TradingView НЕ рекомендует платить за скрипт или использовать его, если вы не доверяете его автору и не понимаете, как скрипт работает. Вы всегда можете найти бесплатные скрипты с открытым исходным кодом в Скриптах сообщества.
Инструкции от автора
Our indicators are suitable for all markets: Crypto, Forex, stocks, etc.
Отказ от ответственности
Скрипт с ограниченным доступом
Только пользователи, одобренные автором, могут получить доступ к этому скрипту. Вам нужно отправить запрос и получить разрешение на его использование. Обычно доступ предоставляется после оплаты. Для получения подробной информации следуйте инструкциям автора ниже или свяжитесь с kronos-algo напрямую.
TradingView НЕ рекомендует платить за скрипт или использовать его, если вы не доверяете его автору и не понимаете, как скрипт работает. Вы всегда можете найти бесплатные скрипты с открытым исходным кодом в Скриптах сообщества.
Инструкции от автора
Our indicators are suitable for all markets: Crypto, Forex, stocks, etc.