OPEN-SOURCE SCRIPT
Обновлено Body/Wick to Range Osc.
This script is meant to be a form of pure candlestick analysis.
Terminology in the description used below is as follows:
- numcands = Number of candles specified by the user to be used for sampling in each moving average.
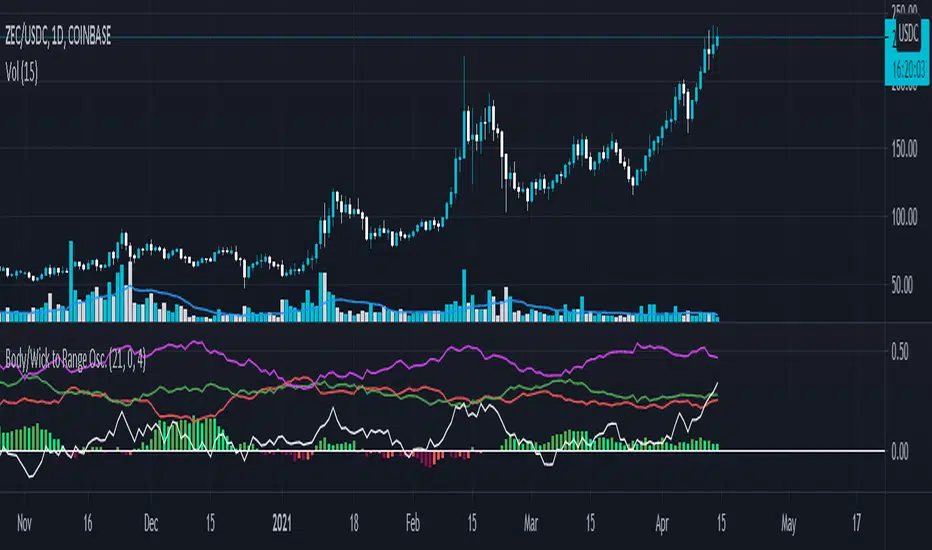
This script plots moving average (SMA/EMA specified by the user [future versions may allow other types of moving averages, I am open to suggestions]) of the percentage of the high-low range that the previous {numcands} candles the upper wicks, lower wicks, and the body take up.
The user may specify if the absolute value of the body percentage is to be used (true by default). To account for this, a horizontal line is also plotted at 0 to show when the body percentage moves above or below 0.
The values that all of these moving averages plotted will oscillate between 0 and 1 (-1 and 1 for the body percentage if the absolute value of candles is not used).
Other notes: The user may select the colors used (colorblind support, as the defaults are red and green). Cross overs and cross unders are accounted for in alertconditions (as is if the body % moves above and below 0% if absolute values are not used).
An interpretation of the use of this script may be: If the upper wicks begin to take up a larger portion of the high-low range, it may signal downward selling pressure (and vise-versa for lower wicks). However, this may be open to interpretation based upon the specified {numcands} used.
Terminology in the description used below is as follows:
- numcands = Number of candles specified by the user to be used for sampling in each moving average.
This script plots moving average (SMA/EMA specified by the user [future versions may allow other types of moving averages, I am open to suggestions]) of the percentage of the high-low range that the previous {numcands} candles the upper wicks, lower wicks, and the body take up.
The user may specify if the absolute value of the body percentage is to be used (true by default). To account for this, a horizontal line is also plotted at 0 to show when the body percentage moves above or below 0.
The values that all of these moving averages plotted will oscillate between 0 and 1 (-1 and 1 for the body percentage if the absolute value of candles is not used).
Other notes: The user may select the colors used (colorblind support, as the defaults are red and green). Cross overs and cross unders are accounted for in alertconditions (as is if the body % moves above and below 0% if absolute values are not used).
An interpretation of the use of this script may be: If the upper wicks begin to take up a larger portion of the high-low range, it may signal downward selling pressure (and vise-versa for lower wicks). However, this may be open to interpretation based upon the specified {numcands} used.
Информация о релизе
Added a histogram that plots the difference between the Upperwick and Lowerwick moving averages.Absolute body value and body values are now plotted together, and switches may be flipped for all plots to turn them on/off.
The histogram features color scheming based upon prior values.
Other notes: Code reduction with a helper function to grab the moving averages also added. Renaming of some variables/inputs. Comment polishing.
Информация о релизе
More comment polishing.Информация о релизе
Clean Chart updateИнформация о релизе
Clean chart update (attempt 2?)Информация о релизе
House-Rules updateСкрипт с открытым кодом
В истинном духе TradingView, создатель этого скрипта сделал его открытым исходным кодом, чтобы трейдеры могли проверить и убедиться в его функциональности. Браво автору! Вы можете использовать его бесплатно, но помните, что перепубликация кода подчиняется нашим Правилам поведения.
Отказ от ответственности
Информация и публикации не предназначены для предоставления и не являются финансовыми, инвестиционными, торговыми или другими видами советов или рекомендаций, предоставленных или одобренных TradingView. Подробнее читайте в Условиях использования.
Скрипт с открытым кодом
В истинном духе TradingView, создатель этого скрипта сделал его открытым исходным кодом, чтобы трейдеры могли проверить и убедиться в его функциональности. Браво автору! Вы можете использовать его бесплатно, но помните, что перепубликация кода подчиняется нашим Правилам поведения.
Отказ от ответственности
Информация и публикации не предназначены для предоставления и не являются финансовыми, инвестиционными, торговыми или другими видами советов или рекомендаций, предоставленных или одобренных TradingView. Подробнее читайте в Условиях использования.