TradeX Labs Pivot Master
This indicator-strategy automation is built for traders who want a simple, consistent, and rules-based trading system—no multi-timeframe chaos or overcomplicated confirmation layers. It trades purely from prior-day price action, keeping volatility, structure, and logic constant across all sessions.
Every entry, stop, and target comes directly from the same volatility-adjusted model. If the trade can’t fit your defined dollar risk, it simply won’t execute or plot.
⸻
IMPORTANT NOTE
***Since TradingView utilizes close of bar for plots, this is best utilized for real time entry/exit signals on 1 second charts or lower. If you do not have 1 second charts we can not recommend you to upgrade your subscription but we HIGHLY recommend utilizing this script on a 1 second chart. If utilizing on any higher time frame any signals or trade logic will be delayed and inaccurate or signals can be entirely skipped altogether and populate incorrect entries***
⸻
Purpose & Core Design
The framework is anchored to prior-day settlement data and mathematically transforms it into real-time, session-specific trading levels. This creates a daily map of opportunity that evolves with volatility while maintaining a consistent structure.
This approach eliminates guesswork and ensures the same conditions that produced historical edge apply to every live session.
⸻
Key Inputs & Control
1. Dollar Risk
Set your maximum dollar risk per trade. The system automatically sizes positions to stay at or below that risk limit based on stop distance.
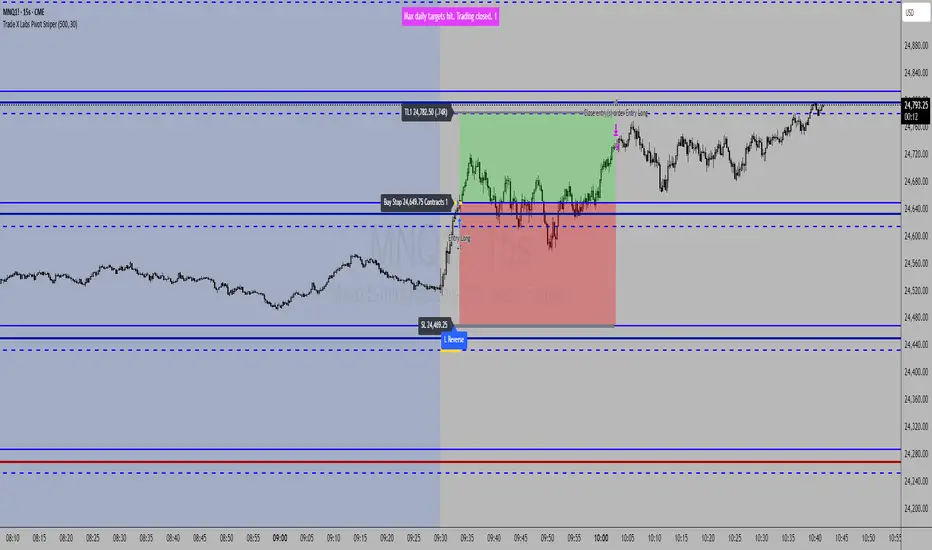
• If the trade qualifies: a red-to-green gradient fill and entry label appear.
• If not: no fill, no entry, no false visual signals.
2. Timer Exit (Default: 30 Minutes)
The strategy is designed for momentum capture in the first 30 minutes after market open. If a trade remains active beyond that time, it is closed automatically.
All back tests and live reports reference this same window to maintain integrity. (Adjustable if you wish.)
3. Days to Keep Lines
Controls how many sessions of plotted levels and fills stay visible (up to 10).
To explore further back, use TradingView’s replay mode. The indicator will continue plotting as far as platform data allows.
4. Font & Label Size
• Price Label Size: Adjusts the numerical price levels beside pivots for manual pre-market entries.
• Level Label Size: Controls the on-chart text size for active trade signals. Both fully customizable.
⸻
Level Structure & Trade Mechanics
All plotted levels originate from a proprietary prior-day volatility formula. You will see:
• Middle Green Horizontal Lines — Support Levels
These mark historically reactive zones where price has a higher probability of holding or bouncing.
• Middle Blue Horizontal Lines — Resistance Levels
These represent opposing zones where price tends to reject or stall.
(Solid and dotted variants handle different roles in execution logic.)
• Red Horizontal Lines — Points of Control (POC Zones)
These are high-impact levels where price historically either rejects violently or breaks with strength.
⸻
Trade Logic
Long Trades
• Trigger: The solid blue line above the current structure acts as the long trigger.
• Stop: The solid blue line below is the stop-loss.
• Target: The next solid blue line above serves as the target.
Long trades are executed when price hits the solid blue trigger above the current level, using solid levels exclusively for entry, stop, and target.
Short Trades
• Trigger: The dotted blue line below the current structure is the short trigger.
• Stop: The dotted blue line above is the stop-loss.
• Target: The next dotted blue line below becomes the target.
Short trades use only dotted levels to define all key mechanics — entry, stop, and target — keeping short setups visually distinct and structurally independent from longs.
This dual structure allows for clean, symmetrical trade logic across both sides of the market, with consistent volatility mapping from prior-day data.
⸻
High-Priority Red Levels (Points of Control)
Red horizontal levels represent areas of major interest — typically where institutional activity concentrated previously. Price often reacts sharply here: either reversing instantly or breaking through with momentum.
These are optional reference points but often signal where the strongest reactions occur.
⸻
Visualization & Behavior
• Executed trades show the red-to-green gradient fill.
• Trades that exceed risk parameters simply do not appear.
• Levels remain clean and persistent day to day for back testing, journaling, or educational
use.
⸻
Disclaimer
This is a closed, proprietary LucrorStrategies tool. It is provided for analytical and educational use only. It does not predict price or guarantee profit. All trade execution, configuration, and outcomes remain the responsibility of the user.
This Update Does Not Affect Manual Trade Placement
Скрипт с ограниченным доступом
Доступ к этому скрипту имеют только пользователи, одобренные автором. Вам необходимо запросить и получить разрешение на его использование. Обычно оно предоставляется после оплаты. Для получения подробной информации следуйте инструкциям автора ниже или свяжитесь напрямую с LucrorStrategies.
TradingView НЕ рекомендует оплачивать или использовать скрипт, если вы полностью не доверяете его автору и не понимаете, как он работает. Вы также можете найти бесплатные, открытые альтернативы в наших скриптах сообщества.
Инструкции от автора
Отказ от ответственности
Скрипт с ограниченным доступом
Доступ к этому скрипту имеют только пользователи, одобренные автором. Вам необходимо запросить и получить разрешение на его использование. Обычно оно предоставляется после оплаты. Для получения подробной информации следуйте инструкциям автора ниже или свяжитесь напрямую с LucrorStrategies.
TradingView НЕ рекомендует оплачивать или использовать скрипт, если вы полностью не доверяете его автору и не понимаете, как он работает. Вы также можете найти бесплатные, открытые альтернативы в наших скриптах сообщества.