PROTECTED SOURCE SCRIPT
Обновлено Kernel Regression Band [dARK]
Introducing The Kernel Regression Band Indicator.
This is a powerful tool designed to assist you in identifying key trends and potential reversals in financial markets. This indicator employs Kernel Regressions, to provide valuable insights into trend dynamics.
Indicator Description:
The Kernel Regression Band Indicator is based on the principles of Kernel Regression analysis, a non-parametric technique widely used in statistical analysis and time series forecasting. It effectively captures and visualizes the underlying trends in price data by smoothing out noisy fluctuations.
Indicator Components:
These two regressions form what I chose to call the Kernel Regression Band.
The Kernel Regression Band Indicator comprises three distinct phases:
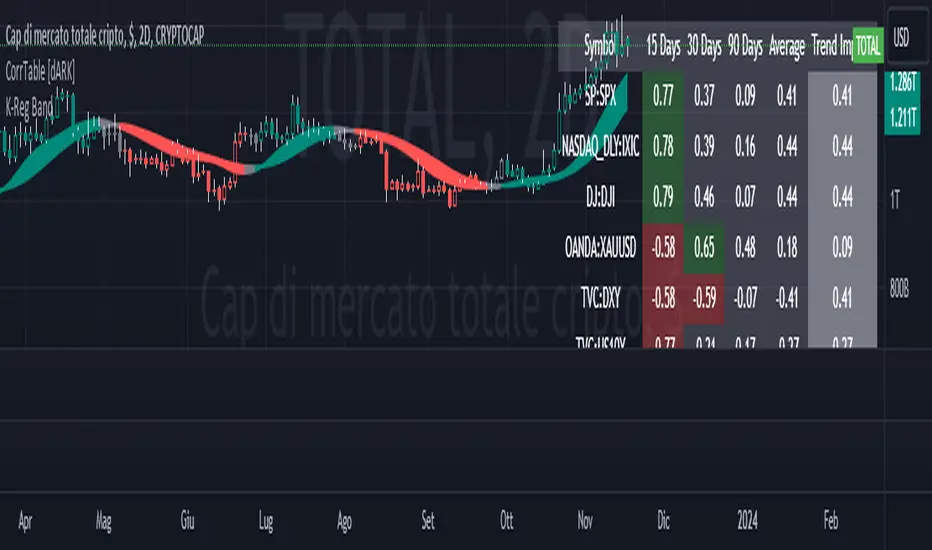
Green Band (Uptrend):
It is colored green when both Kernel Regressions are rising concurrently.
This signals a strong uptrend in the market.
Red Band (Downtrend):
It is colored red when both Kernel Regressions are declining simultaneously.
This indicates a pronounced downtrend in the market.
Grey Zone (Transitional):
The area between the upper and lower bands is colored grey when one Kernel Regression is rising while the other one is declining.
This signifies a transitional phase where market forces are shifting, and uncertainty prevails.
Usage:
You can utilize the Kernel Regression Band Indicator as follows:
Uptrend Confirmation: A green band suggests a strong uptrend, providing a bullish signal to consider long positions or stay invested.
Downtrend Confirmation: A red band indicates a significant downtrend, offering a bearish signal to consider short positions or exit long positions.
Transition Warning: The grey zone serves as a cautionary signal, suggesting that market conditions are in flux, and traders should exercise caution. It can be seen as a warning of potential trend reversals or consolidations.
Keep in mind you can play with settings.
These default ones are pretty good and were used on a 2D chart;
But it's your choice if you want to play with those, to find your best settings.
Enjoy! :)
This is a powerful tool designed to assist you in identifying key trends and potential reversals in financial markets. This indicator employs Kernel Regressions, to provide valuable insights into trend dynamics.
Indicator Description:
The Kernel Regression Band Indicator is based on the principles of Kernel Regression analysis, a non-parametric technique widely used in statistical analysis and time series forecasting. It effectively captures and visualizes the underlying trends in price data by smoothing out noisy fluctuations.
Indicator Components:
- Fast Kernel Regression
- Slow Kernel Regression
These two regressions form what I chose to call the Kernel Regression Band.
The Kernel Regression Band Indicator comprises three distinct phases:
Green Band (Uptrend):
It is colored green when both Kernel Regressions are rising concurrently.
This signals a strong uptrend in the market.
Red Band (Downtrend):
It is colored red when both Kernel Regressions are declining simultaneously.
This indicates a pronounced downtrend in the market.
Grey Zone (Transitional):
The area between the upper and lower bands is colored grey when one Kernel Regression is rising while the other one is declining.
This signifies a transitional phase where market forces are shifting, and uncertainty prevails.
Usage:
You can utilize the Kernel Regression Band Indicator as follows:
Uptrend Confirmation: A green band suggests a strong uptrend, providing a bullish signal to consider long positions or stay invested.
Downtrend Confirmation: A red band indicates a significant downtrend, offering a bearish signal to consider short positions or exit long positions.
Transition Warning: The grey zone serves as a cautionary signal, suggesting that market conditions are in flux, and traders should exercise caution. It can be seen as a warning of potential trend reversals or consolidations.
Keep in mind you can play with settings.
These default ones are pretty good and were used on a 2D chart;
But it's your choice if you want to play with those, to find your best settings.
Enjoy! :)
Информация о релизе
Transparency Adjustment Added.Информация о релизе
Fixed Typo in description.Скрипт с защищённым кодом
Этот скрипт опубликован с закрытым исходным кодом. Однако вы можете использовать его свободно и без каких-либо ограничений — читайте подробнее здесь.
Отказ от ответственности
Информация и публикации не предназначены для предоставления и не являются финансовыми, инвестиционными, торговыми или другими видами советов или рекомендаций, предоставленных или одобренных TradingView. Подробнее читайте в Условиях использования.
Скрипт с защищённым кодом
Этот скрипт опубликован с закрытым исходным кодом. Однако вы можете использовать его свободно и без каких-либо ограничений — читайте подробнее здесь.
Отказ от ответственности
Информация и публикации не предназначены для предоставления и не являются финансовыми, инвестиционными, торговыми или другими видами советов или рекомендаций, предоставленных или одобренных TradingView. Подробнее читайте в Условиях использования.