OPEN-SOURCE SCRIPT
Обновлено XAU 0/5 Grid
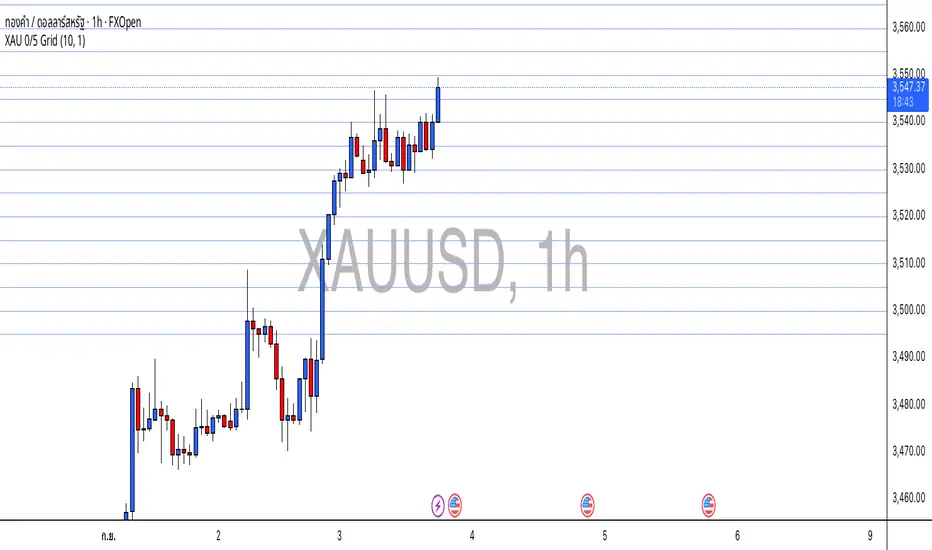
This indicator draws horizontal price grids for XAUUSD. It anchors the grid to a base price that ends with 0 or 5, then plots equally spaced levels every 5 price units above and below that base. It’s a clean way to eyeball fixed-interval structure for rough support/resistance zones and simple TP/SL planning.
How it works
Base (0/5):
base = floor(close / 5) × 5 → forces the base to always end with 0/5.
Grid levels:
level_i = base + i × 5, where i is any integer (positive/negative).
The script updates positions only when the base changes to avoid flicker and reduce chart load.
It uses a persistent line array to manage the line objects efficiently.
Usage
Add the indicator to an XAUUSD chart on any timeframe.
Configure in the panel:
Show Lines – toggle visibility
Lines each side – number of lines above/below the base
Line Color / Line Width – appearance
Use the grid as fixed reference levels (e.g., 3490, 3495, 3500, 3505, …) for planning TP/SL or observing grid breaks.
Highlights
Strict 0/5 anchoring keeps levels evenly spaced and easy to read on gold.
Auto-reanchors when price moves to a new 0/5 zone, maintaining a steady view.
Lightweight design: lines are created once and then updated, minimizing overhead.
Limitations
Visualization only — not a buy/sell signal.
Spacing is fixed at 5 price units, optimized for XAUUSD. If used on other symbols/brokers with different tick scales, adjust the logic accordingly.
Grid lines do not guarantee support/resistance; always combine with broader market context.
Информация о релизе
fix bugИнформация о релизе
fix bugСкрипт с открытым кодом
В истинном духе TradingView, создатель этого скрипта сделал его открытым исходным кодом, чтобы трейдеры могли проверить и убедиться в его функциональности. Браво автору! Вы можете использовать его бесплатно, но помните, что перепубликация кода подчиняется нашим Правилам поведения.
Отказ от ответственности
Информация и публикации не предназначены для предоставления и не являются финансовыми, инвестиционными, торговыми или другими видами советов или рекомендаций, предоставленных или одобренных TradingView. Подробнее читайте в Условиях использования.
Скрипт с открытым кодом
В истинном духе TradingView, создатель этого скрипта сделал его открытым исходным кодом, чтобы трейдеры могли проверить и убедиться в его функциональности. Браво автору! Вы можете использовать его бесплатно, но помните, что перепубликация кода подчиняется нашим Правилам поведения.
Отказ от ответственности
Информация и публикации не предназначены для предоставления и не являются финансовыми, инвестиционными, торговыми или другими видами советов или рекомендаций, предоставленных или одобренных TradingView. Подробнее читайте в Условиях использования.