OPEN-SOURCE SCRIPT
2024 - Seasonality - Open to Close

Script Description:
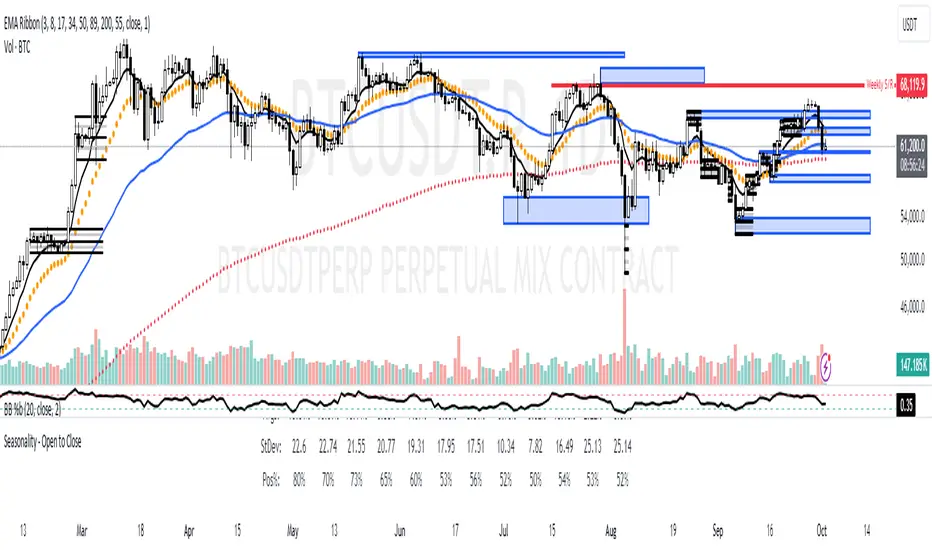
This Pine Script is designed to visualise **seasonality** in the financial markets by calculating the **open-to-close percentage change** for each month of a selected asset. It creates a **heatmap** table to display the monthly performance over multiple years. The script provides detailed statistical summaries, including:
- **Average monthly percentage changes**
- **Standard deviation** of the changes
- **Percentage of months with positive returns**
The script also allows users to adjust colour intensities for positive and negative values, specify which year to start from, and skip specific months. Key metrics such as averages, standard deviations, and percentages of positive months can be toggled on or off based on user preferences. The result is a clear, visual representation of how an asset typically performs month by month, aiding in seasonality analysis.
Скрипт с открытым кодом
В истинном духе TradingView, создатель этого скрипта сделал его открытым исходным кодом, чтобы трейдеры могли проверить и убедиться в его функциональности. Браво автору! Вы можете использовать его бесплатно, но помните, что перепубликация кода подчиняется нашим Правилам поведения.
Отказ от ответственности
Информация и публикации не предназначены для предоставления и не являются финансовыми, инвестиционными, торговыми или другими видами советов или рекомендаций, предоставленных или одобренных TradingView. Подробнее читайте в Условиях использования.