OPEN-SOURCE SCRIPT
QQE MT4
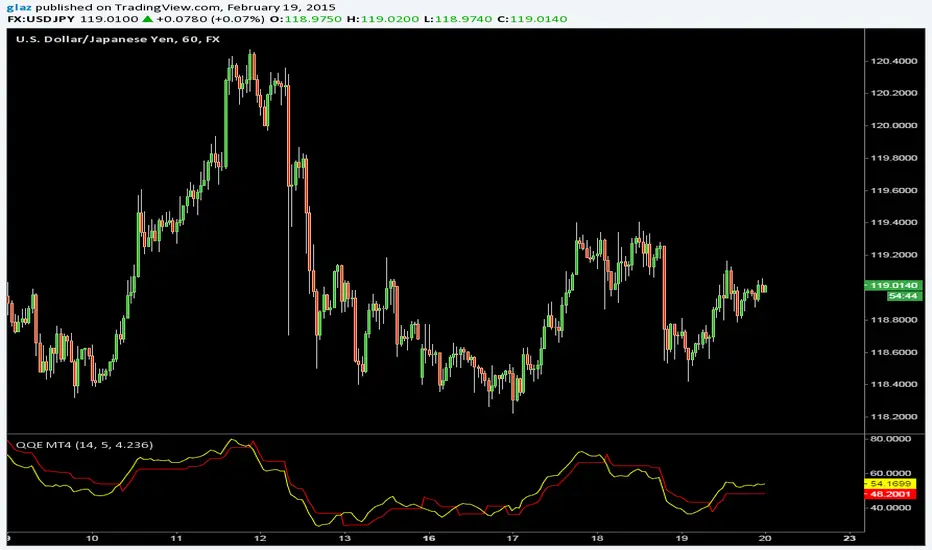
QQE (Quantative Qualitative Estimation) MT4 Version by Roman Ignatov
Another indicator from MT4 to pinescript, from a google search i found the that the original author is unknown and its best used for volatile pairs /JPY
yellow line is a smoothed rsi,
red line "slow trailing stop" is the ATR smoothing with a 14-periods wilders smoothing function that is multiplied by a factor of 4.236
Also big thanks to BlindFreddy, i used part of his supertrend indicator to make it work
Скрипт с открытым кодом
В истинном духе TradingView автор этого скрипта опубликовал его с открытым исходным кодом, чтобы трейдеры могли понять, как он работает, и проверить на практике. Вы можете воспользоваться им бесплатно, но повторное использование этого кода в публикации регулируется Правилами поведения.
Отказ от ответственности
Все виды контента, которые вы можете увидеть на TradingView, не являются финансовыми, инвестиционными, торговыми или любыми другими рекомендациями. Мы не предоставляем советы по покупке и продаже активов. Подробнее — в Условиях использования TradingView.