OPEN-SOURCE SCRIPT
Обновлено Price Change History
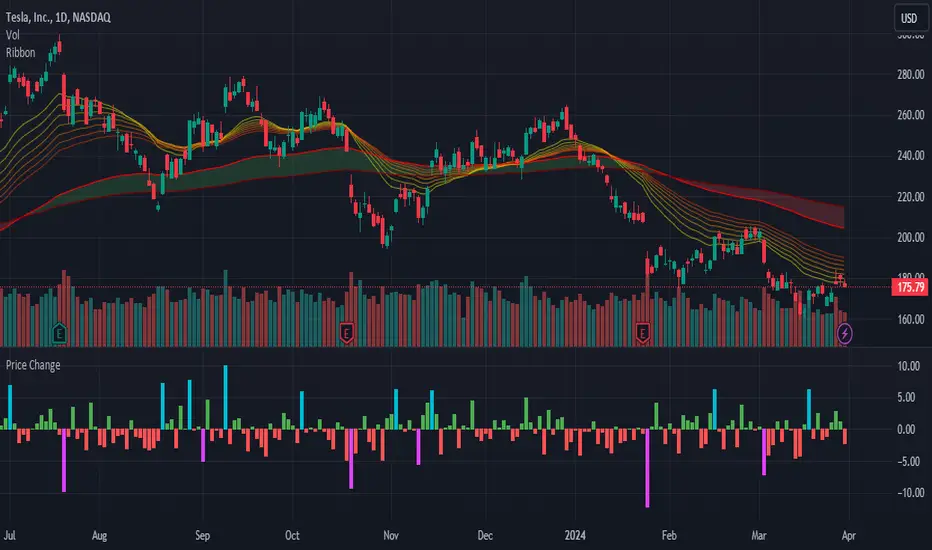
Display a histogram of price changes over a given interval. Show change as a percentage or in dollar amount. Highlight changes that exceed a particular value.
Информация о релизе
By default, the histogram shows price change since the previous bar. This update allows you to display price change since any number of bars ago.Информация о релизе
Separate high and low highlighting.Информация о релизе
Update study shorttitle.Информация о релизе
The ratio of highlighted to unhighlighted bars is now shown as the orange number ranging from 0 to 1.It takes into consideration the previous 50 bars by default, but can be changed by the user under settings.
Информация о релизе
- Updated the names of a few settings to be clearer as to what they do.- Included some documentation in the source code to explain each setting.
Информация о релизе
- Add default precision
- Improve comments
Информация о релизе
Updated to Pine Script v4Информация о релизе
- Update to Pine Script v5- Additional comments
- Code cleanup
Скрипт с открытым кодом
В истинном духе TradingView, создатель этого скрипта сделал его открытым исходным кодом, чтобы трейдеры могли проверить и убедиться в его функциональности. Браво автору! Вы можете использовать его бесплатно, но помните, что перепубликация кода подчиняется нашим Правилам поведения.
Отказ от ответственности
Информация и публикации не предназначены для предоставления и не являются финансовыми, инвестиционными, торговыми или другими видами советов или рекомендаций, предоставленных или одобренных TradingView. Подробнее читайте в Условиях использования.