OPEN-SOURCE SCRIPT
Compression support&resistance [LM]
Hello traders,
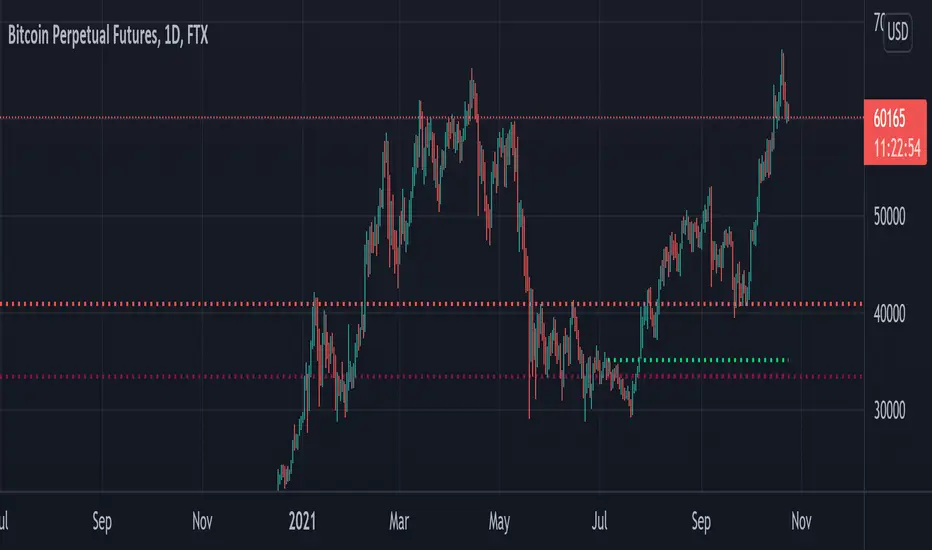
I would like to present you Compression support&resistance script. The idea behind is to look for areas of price compression(inside bar candles). Basically the S/R lines are created after three candles that are formed in certain pattern and volume conditions. First candle of pattern is usually the most volatile and fist inside bar after volatile candle high and low creates S/R lines in order to look for breakouts or for future bounces of the S/R line. Also by default volume has to be decreasing from candle to candle, although this condition can be controlled by setting.

It has various settings as my other S/R scripts for multi timeframe analysis. The current timeframe uses line API but for multi timeframe I use plot lines. There are two filters. Volume filter for declining volume of the pattern candles and volatility filter which renders line only in case that pattern occurs after some % change has happened within some lookback period.
Credit also for this indicator goes to @berkek as he took time to explain it to me.
Hope you will enjoy it,
Lukas
I would like to present you Compression support&resistance script. The idea behind is to look for areas of price compression(inside bar candles). Basically the S/R lines are created after three candles that are formed in certain pattern and volume conditions. First candle of pattern is usually the most volatile and fist inside bar after volatile candle high and low creates S/R lines in order to look for breakouts or for future bounces of the S/R line. Also by default volume has to be decreasing from candle to candle, although this condition can be controlled by setting.
It has various settings as my other S/R scripts for multi timeframe analysis. The current timeframe uses line API but for multi timeframe I use plot lines. There are two filters. Volume filter for declining volume of the pattern candles and volatility filter which renders line only in case that pattern occurs after some % change has happened within some lookback period.
Credit also for this indicator goes to @berkek as he took time to explain it to me.
Hope you will enjoy it,
Lukas
Скрипт с открытым кодом
В истинном духе TradingView, создатель этого скрипта сделал его открытым исходным кодом, чтобы трейдеры могли проверить и убедиться в его функциональности. Браво автору! Вы можете использовать его бесплатно, но помните, что перепубликация кода подчиняется нашим Правилам поведения.
Отказ от ответственности
Информация и публикации не предназначены для предоставления и не являются финансовыми, инвестиционными, торговыми или другими видами советов или рекомендаций, предоставленных или одобренных TradingView. Подробнее читайте в Условиях использования.