OPEN-SOURCE SCRIPT
Candle Volume (Alender)

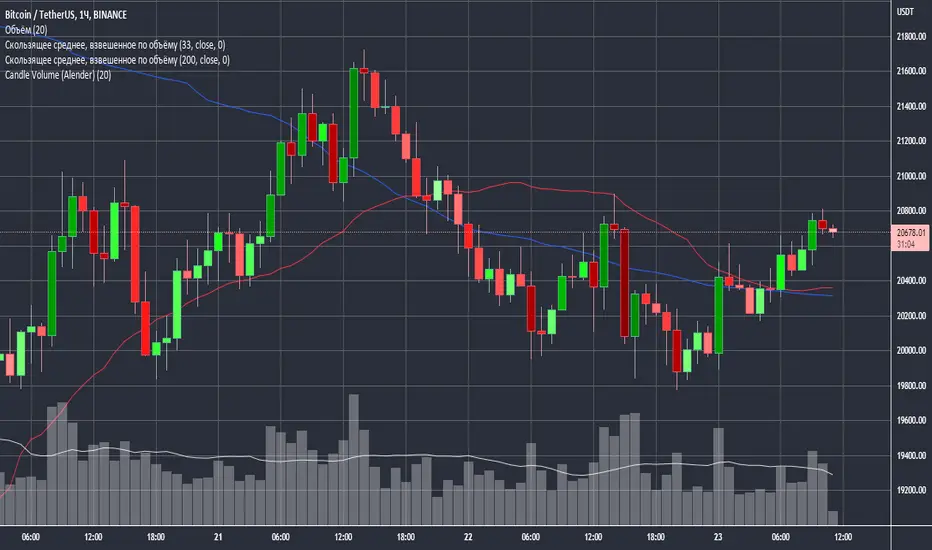
Candle Volume by Alender is an indicator that changes the color of candles depending on the volume.
If you use VSA (Volume Spread Analysis) - this indicator will allow you to quickly assess the market situation.
For plotting, a moving average by volume for the specified period is used. Volume/Average * 100 - percentage of the current volume from the average.
* If the current volume is less than the average - the candle will be proportionally (0-100%) lighter than red (for bearish candles) or green (for bullish candles). For 0% - the candle is as light as possible.
* If the current volume is greater than the average, the candle will be proportionately (100-400%) darker than red (for bearish candles) or green (for bullish candles). For 400% and more - the candle is as dark as possible.
Скрипт с открытым кодом
В истинном духе TradingView, создатель этого скрипта сделал его открытым исходным кодом, чтобы трейдеры могли проверить и убедиться в его функциональности. Браво автору! Вы можете использовать его бесплатно, но помните, что перепубликация кода подчиняется нашим Правилам поведения.
Отказ от ответственности
Информация и публикации не предназначены для предоставления и не являются финансовыми, инвестиционными, торговыми или другими видами советов или рекомендаций, предоставленных или одобренных TradingView. Подробнее читайте в Условиях использования.