OPEN-SOURCE SCRIPT
Volume candle by Moond
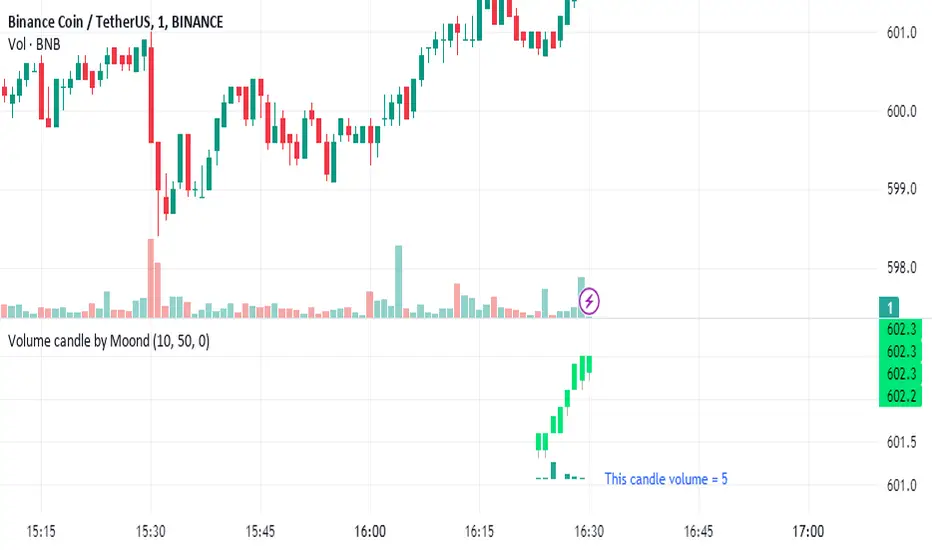
Indicator Description: Equal Volume Candle Chart
This indicator creates a real-time candlestick chart where each candle forms upon the completion of a specific volume threshold, rather than within fixed time intervals. The candles update dynamically based on the total volume traded, providing a unique perspective that incorporates market activity directly into price movements.
Key Features:
Dynamic Candles Based on Volume: Candles form when a defined lot size of volume is reached, making each candle represent consistent trading activity rather than a fixed time period.
Customizable Volume Lot Size: Users can easily adjust the volume threshold to suit different trading styles or asset classes.
Real-Time Market Reflection: The chart responds to changes in market volume, offering a clearer view of market intensity and momentum.
Concept Behind the Indicator: Traditional candlestick charts operate on time intervals, which can ignore the influence of volume in price changes. By basing the candle formation on equal volumes, this indicator integrates both price and traded volume into the visual representation, helping traders capture key shifts in market sentiment and activity that might be missed on time-based charts
Скрипт с открытым кодом
В истинном духе TradingView, создатель этого скрипта сделал его открытым исходным кодом, чтобы трейдеры могли проверить и убедиться в его функциональности. Браво автору! Вы можете использовать его бесплатно, но помните, что перепубликация кода подчиняется нашим Правилам поведения.
Отказ от ответственности
Информация и публикации не предназначены для предоставления и не являются финансовыми, инвестиционными, торговыми или другими видами советов или рекомендаций, предоставленных или одобренных TradingView. Подробнее читайте в Условиях использования.