OPEN-SOURCE SCRIPT
Cycle Oscillator

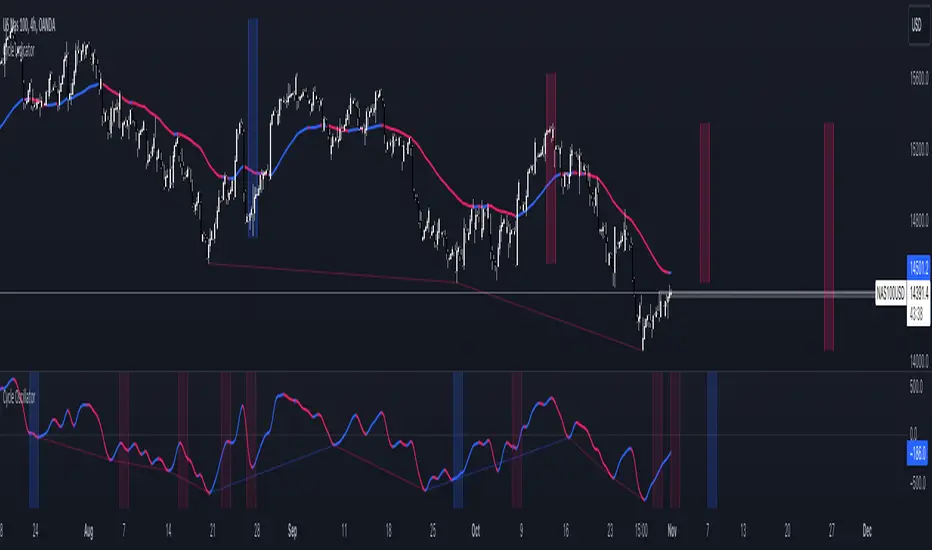
The Cycle Oscillator is a tool developed to help traders analyze market cycles thanks to a simplified version of the Hurst theory and the easy visualization provided by the detrended cycle.
This indicator has two functions:
- The first one is the plotting of a line that oscillates above and below the zero line, which can be used to find the cycle direction and momentum
- The second feature is the next-cycle bottom forecaster, useful for estimating the timing of the future pivot low based on the pivot low of the oscillator.
This last feature shows graphically the period in which the next low will probably happen, using as a calculation method the timing of the previous indicator's lows.
Additionally, the user can choose to modify the cycle length to analyze bigger or smaller price movements.
This indicator can be greatly used in combination with other Cycle Indicators to gain more confluence in the plotted time areas.
Скрипт с открытым кодом
В истинном духе TradingView, создатель этого скрипта сделал его открытым исходным кодом, чтобы трейдеры могли проверить и убедиться в его функциональности. Браво автору! Вы можете использовать его бесплатно, но помните, что перепубликация кода подчиняется нашим Правилам поведения.
Отказ от ответственности
Информация и публикации не предназначены для предоставления и не являются финансовыми, инвестиционными, торговыми или другими видами советов или рекомендаций, предоставленных или одобренных TradingView. Подробнее читайте в Условиях использования.