PROTECTED SOURCE SCRIPT
Обновлено 4H-50/50 Method
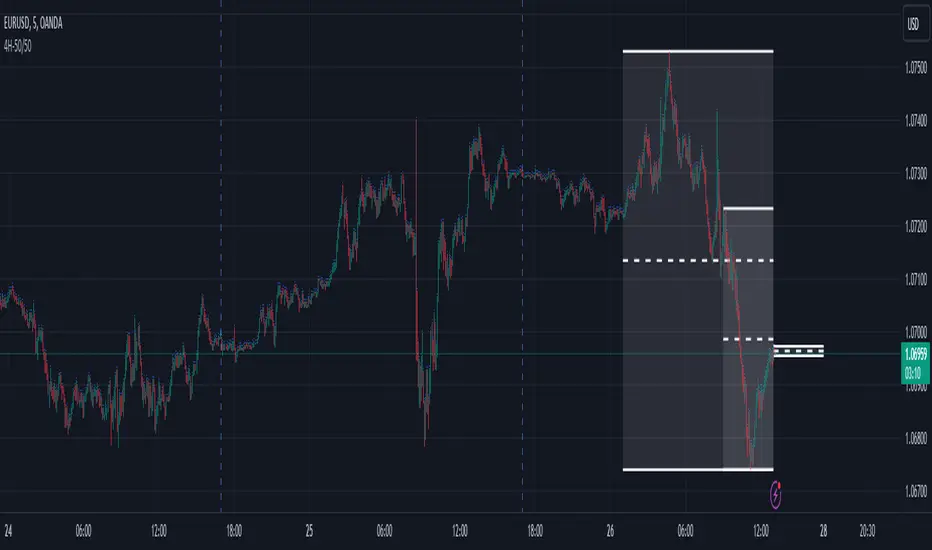
4H-50/50 tool is a way to visualize top down analysis.
• There are three boxes illustrated on the chart
- One box shows the past 4 hour time frame's high, low and center
- One box shows the past 12 hour time frame's high, low and center
- The last box is the current 4 hour time frame's high, low and center
• Four hour blocks start on specific hours 1, 5, 9, 13, 17 & 21
• The 50% marks can act as resistance/support
• The 50% marks can also show trend
- If the instrument is trading below all 50% lines, this is one indication that price will remain low or go lower.
- If the instrument is trading above all 50% lines, this is one indication that price will remain high or go higher
• The indicator can also show sentiment values, which can be found on several outside websites
- After entering both the long and short sentiment, a 10 pip bumper will appear around these sentiment numbers giving another form of support/resistance to watch for
Current limitations:
• The four hour blocks currently only work on the 5 minute candle timeframe
• The sentiment bumper size and color are fixed
Bugs?
Kindly report any issues you run into and I'll try to fix them promptly.
Thank you!
Информация о релизе
4H-50/50 tool is a way to visualize top down analysis.• There are three boxes illustrated on the chart
- One box shows the past 4 hour time frame's high, low and center
- One box shows the past 12 hour time frame's high, low and center
- The last box is the current 4 hour time frame's high, low and center
• Four hour blocks start on specific hours 1, 5, 9, 13, 17 & 21
• The 50% marks can act as resistance/support
• The 50% marks can also show trend
- If the instrument is trading below all 50% lines, this is one indication that price will remain low or go lower.
- If the instrument is trading above all 50% lines, this is one indication that price will remain high or go higher
• The indicator can also show sentiment values, which can be found on several outside websites
- After entering both the long and short sentiment, a 10 pip bumper will appear around these sentiment numbers giving another form of support/resistance to watch for
Current limitations:
• The four hour blocks currently only work on the 5 minute candle timeframe
• The sentiment bumper size and color are fixed
Bugs?
Kindly report any issues you run into and I'll try to fix them promptly.
Thank you!
Скрипт с защищённым кодом
Этот скрипт опубликован с закрытым исходным кодом. Однако вы можете использовать его свободно и без каких-либо ограничений — читайте подробнее здесь.
Отказ от ответственности
Информация и публикации не предназначены для предоставления и не являются финансовыми, инвестиционными, торговыми или другими видами советов или рекомендаций, предоставленных или одобренных TradingView. Подробнее читайте в Условиях использования.