OPEN-SOURCE SCRIPT
Обновлено Colored ADX with DI+/- and thresholds
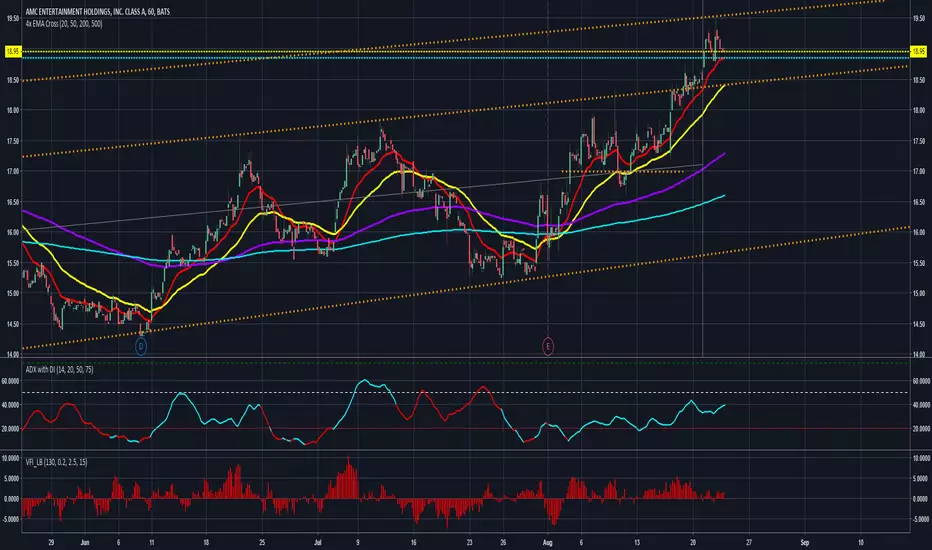
Average Directional Index ( ADX )
Based off of MasaNakamura's implementation, modified to show high & super-high momentum thresholds. In addition, coloring the trend line by the prevailing trend direction from the DI (Red if down, Green if up) allows you to remove the DI if you want to reduce chart clutter!
"The Average Directional Index (ADX), Minus Directional Indicator (-DI) and Plus Directional Indicator (+DI) represent a group of directional movement indicators that form a trading system developed by Welles Wilder....
The Plus Directional Indicator (+DI) and Minus Directional Indicator (-DI) are derived from smoothed averages of these differences, and measure trend direction over time. These two indicators are often referred to collectively as the Directional Movement Indicator (DMI).
The Average Directional Index (ADX) is in turn derived from the smoothed averages of the difference between +DI and -DI, and measures the strength of the trend (regardless of direction) over time.
Using these three indicators together, chartists can determine both the direction and strength of the trend....
At its most basic, the Average Directional Index (ADX) can be used to determine if a security is trending or not. This determination helps traders choose between a trend-following system or a non-trend-following system. Wilder suggests that a strong trend is present when ADX is above 20..."
See
investopedia.com/articles/trading/07/adx-trend-indicator.asp
stockcharts.com/school/doku.php?st=adx&id=chart_school:technical_indicators:average_directional_index_adx
for detail.
 AMD
AMD
There are more plans to add vertical lines on crosses and divergence indicators so stay tuned!
Thank you and good trading!
Based off of MasaNakamura's implementation, modified to show high & super-high momentum thresholds. In addition, coloring the trend line by the prevailing trend direction from the DI (Red if down, Green if up) allows you to remove the DI if you want to reduce chart clutter!
"The Average Directional Index (ADX), Minus Directional Indicator (-DI) and Plus Directional Indicator (+DI) represent a group of directional movement indicators that form a trading system developed by Welles Wilder....
The Plus Directional Indicator (+DI) and Minus Directional Indicator (-DI) are derived from smoothed averages of these differences, and measure trend direction over time. These two indicators are often referred to collectively as the Directional Movement Indicator (DMI).
The Average Directional Index (ADX) is in turn derived from the smoothed averages of the difference between +DI and -DI, and measures the strength of the trend (regardless of direction) over time.
Using these three indicators together, chartists can determine both the direction and strength of the trend....
At its most basic, the Average Directional Index (ADX) can be used to determine if a security is trending or not. This determination helps traders choose between a trend-following system or a non-trend-following system. Wilder suggests that a strong trend is present when ADX is above 20..."
See
investopedia.com/articles/trading/07/adx-trend-indicator.asp
stockcharts.com/school/doku.php?st=adx&id=chart_school:technical_indicators:average_directional_index_adx
for detail.
There are more plans to add vertical lines on crosses and divergence indicators so stay tuned!
Thank you and good trading!
Информация о релизе
Added A color-correlation option to change colors based on the DI+/- to show the trend direction, or based on the threshold/magnitude of the trendСкрипт с открытым кодом
В истинном духе TradingView, создатель этого скрипта сделал его открытым исходным кодом, чтобы трейдеры могли проверить и убедиться в его функциональности. Браво автору! Вы можете использовать его бесплатно, но помните, что перепубликация кода подчиняется нашим Правилам поведения.
Отказ от ответственности
Информация и публикации не предназначены для предоставления и не являются финансовыми, инвестиционными, торговыми или другими видами советов или рекомендаций, предоставленных или одобренных TradingView. Подробнее читайте в Условиях использования.
Скрипт с открытым кодом
В истинном духе TradingView, создатель этого скрипта сделал его открытым исходным кодом, чтобы трейдеры могли проверить и убедиться в его функциональности. Браво автору! Вы можете использовать его бесплатно, но помните, что перепубликация кода подчиняется нашим Правилам поведения.
Отказ от ответственности
Информация и публикации не предназначены для предоставления и не являются финансовыми, инвестиционными, торговыми или другими видами советов или рекомендаций, предоставленных или одобренных TradingView. Подробнее читайте в Условиях использования.