OPEN-SOURCE SCRIPT
Обновлено Morning Break Out
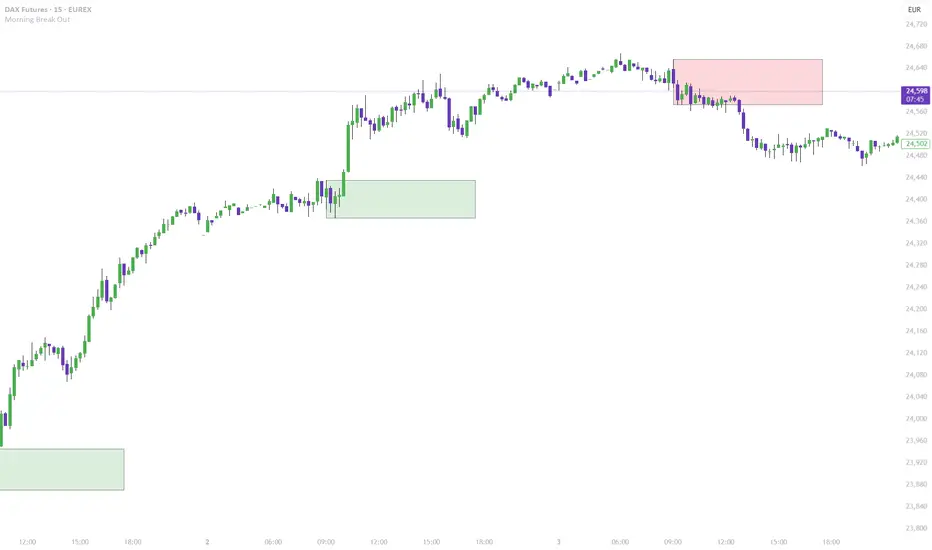
This indicator visualizes a classic morning breakout setup for the DAX and other European markets. The first hour often sets the tone for the trading day — this tool helps you identify that visually and react accordingly.
🔍 How It Works:
Box Range Calculation:
The high and low between 09:00 and 10:00 define the top and bottom of the box.
Color Logic:
Green: Price breaks above the box after 10:00 → bullish breakout
Red: Price breaks below the box after 10:00 → bearish breakout
Gray: No breakout → neutral phase
📈 Use Cases:
Identify breakout setups visually
Ideal for intraday traders and momentum strategies
Combine with volume or trend filters
⚙️ Notes:
Recommended for timeframes 1-minute and above
Uses the chart’s local timezone (e.g. CET/CEST for XETRA/DAX)
Works on all instruments with data before 09:00 — perfect for DAX, EuroStoxx, futures, FX, CFDs, etc.
Информация о релизе
This indicator visualizes a classic morning breakout setup for the DAX and other European markets. The first hour often sets the tone for the trading day — this tool helps you identify that visually and react accordingly.🔍 How It Works:
Box Range Calculation:
The high and low between 09:00 and 10:00 define the top and bottom of the box.
Color Logic:
Green: Price breaks above the box after 10:00 → bullish breakout
Red: Price breaks below the box after 10:00 → bearish breakout
Gray: No breakout → neutral phase
📈 Use Cases:
Identify breakout setups visually
Ideal for intraday traders and momentum strategies
Combine with volume or trend filters
⚙️ Notes:
Recommended for timeframes 1-minute and above
Uses the chart’s local timezone (e.g. CET/CEST for XETRA/DAX)
Works on all instruments with data before 09:00 — perfect for DAX, EuroStoxx, futures, FX, CFDs, etc.
Скрипт с открытым кодом
В истинном духе TradingView, создатель этого скрипта сделал его открытым исходным кодом, чтобы трейдеры могли проверить и убедиться в его функциональности. Браво автору! Вы можете использовать его бесплатно, но помните, что перепубликация кода подчиняется нашим Правилам поведения.
Отказ от ответственности
Информация и публикации не предназначены для предоставления и не являются финансовыми, инвестиционными, торговыми или другими видами советов или рекомендаций, предоставленных или одобренных TradingView. Подробнее читайте в Условиях использования.