PROTECTED SOURCE SCRIPT
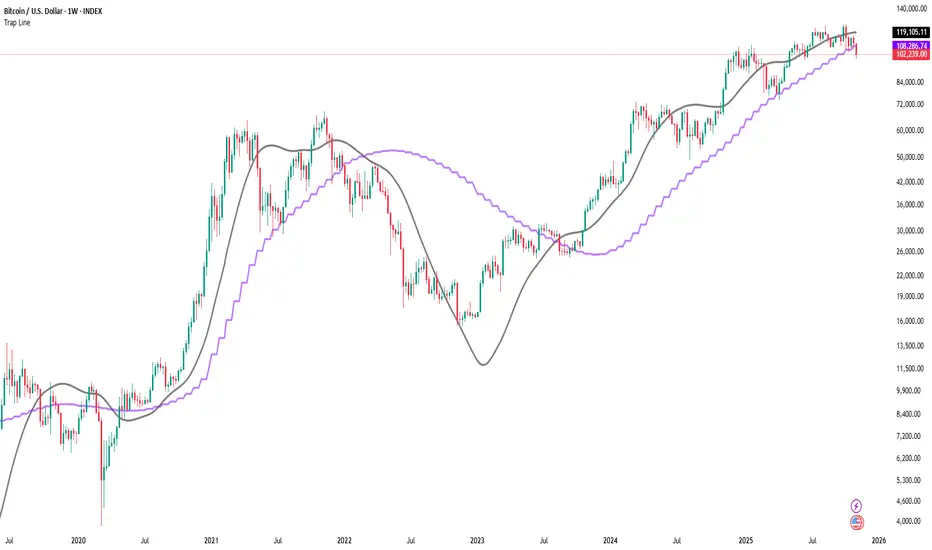
Trap Line
Overview
Trap Line is a higher-timeframe trend framework designed to define market regimes using smoothed weekly (1W) and three-week (3W) baselines. Price trading above the line reflects a bullish regime; price below the line reflects a bearish one. The goal is regime discipline—stay aligned with the dominant higher-timeframe direction and avoid late, emotional entries. All parameters are fixed to ensure consistent behavior across symbols.
Core logic (concepts, not full code)
• Computes a Hull-type moving average on 1W and 3W closes (with optional linear-regression pre-filtering) and projects them onto lower timeframes via interpolation.
• Produces a smooth, lag-reduced structural baseline that tracks the weekly trend path.
• Observing price vs. the baseline highlights potential trap zones—temporary breaches that often fail without a confirmed weekly close.
• The 3-Week Trap Line adds a macro confirmation layer and is hidden by default in the Style tab to keep charts clean.
Inputs
• Parameters (length, smoothing type, regression toggle, interpolation mode) are fixed to prevent overfitting and preserve repeatability.
How to read it
• Above the line => bullish regime.

• Below the line => bearish regime.

• A confirmed weekly close through the line suggests a regime transition.
• A weekly close above the line with a green candle supports bullish continuation; a weekly close below the line with a red candle supports bearish continuation.
• Intraweek deviations near the line are often noise and may fade.
Practical use cases
• Weekly bias filter for swing/position frameworks.
• Regime confirmation across related assets or sectors.
• Portfolio overlay: favor long exposure in bullish regimes; reduce risk in bearish regimes.
• Combine with volume or ATR-based tools to assess trend quality.
Best practices
• Wait for the weekly close before declaring regime flips.
• Avoid overreacting to intraweek moves around the baseline.
• Combine with structure analysis (HH/HL vs. LH/LL) and higher-timeframe S/R.
• Use standard time-based candles; avoid interpreting signals on Heikin Ashi, Renko, Kagi, Point & Figure, or Range charts.
Technical notes
• Built on locked higher-timeframe data (1W and 3W).
• Interpolation is used to render HTF structure smoothly on lower charts.
• Non-repainting: values finalize when the higher timeframe closes; lower-TF plotting is interpolated, not forward-looking.
Who it is for
• Traders who want a consistent, rules-based higher-timeframe bias filter.
• Systematic users who prefer fixed-parameter baselines for regime context.
Limitations & disclosures
• Closed-source; educational and analytical use only.
• Not financial advice. Markets involve risk; past performance does not guarantee future results.
Release notes
• Includes the 3-Week Trap Line (3W). It is hidden by default in the Style tab; enable it if you want an additional macro confirmation layer.
• Fixed-parameter design (no user-tweakable inputs) for consistent behavior across symbols.
• Non-repainting values finalize on 1W/3W candle close.
Originality & why closed-source
This is not a reimplementation of public open-source scripts. Trap Line uses a specific combination of higher-timeframe Hull smoothing, optional linear-regression pre-filtering, and lower-timeframe interpolation designed to expose trap zones (temporary regime breaches that often fail without a confirmed weekly close). The integration and thresholds are proprietary and tuned to retain weekly structure with reduced lag. The source is closed to protect this implementation.
Integration, not a mashup
Trap Line is a single, self-contained framework. It does not merely merge other indicators; its components are integrated to produce a unified higher-timeframe baseline (1W/3W) with a defined reading protocol (above/below line, weekly-close confirmation, optional candle-color confirmation).
Indicator, not a strategy
This publication provides an indicator overlay, not a trading strategy. It includes no backtests, position logic, performance claims, or risk assumptions. Use it as an analytical bias filter within your own risk management.
Comparison to common tools
Compared to standard MAs or SuperTrend-style bands, Trap Line prioritizes (1) higher-timeframe structure fidelity, (2) reduced lag via HMA-type smoothing, and (3) explicit weekly-close confirmation to avoid premature regime flips. The optional 3-Week line acts as a macro confirmation layer and is hidden by default in the Style tab.
Trap Line is a higher-timeframe trend framework designed to define market regimes using smoothed weekly (1W) and three-week (3W) baselines. Price trading above the line reflects a bullish regime; price below the line reflects a bearish one. The goal is regime discipline—stay aligned with the dominant higher-timeframe direction and avoid late, emotional entries. All parameters are fixed to ensure consistent behavior across symbols.
Core logic (concepts, not full code)
• Computes a Hull-type moving average on 1W and 3W closes (with optional linear-regression pre-filtering) and projects them onto lower timeframes via interpolation.
• Produces a smooth, lag-reduced structural baseline that tracks the weekly trend path.
• Observing price vs. the baseline highlights potential trap zones—temporary breaches that often fail without a confirmed weekly close.
• The 3-Week Trap Line adds a macro confirmation layer and is hidden by default in the Style tab to keep charts clean.
Inputs
• Parameters (length, smoothing type, regression toggle, interpolation mode) are fixed to prevent overfitting and preserve repeatability.
How to read it
• Above the line => bullish regime.
• Below the line => bearish regime.
• A confirmed weekly close through the line suggests a regime transition.
• A weekly close above the line with a green candle supports bullish continuation; a weekly close below the line with a red candle supports bearish continuation.
• Intraweek deviations near the line are often noise and may fade.
Practical use cases
• Weekly bias filter for swing/position frameworks.
• Regime confirmation across related assets or sectors.
• Portfolio overlay: favor long exposure in bullish regimes; reduce risk in bearish regimes.
• Combine with volume or ATR-based tools to assess trend quality.
Best practices
• Wait for the weekly close before declaring regime flips.
• Avoid overreacting to intraweek moves around the baseline.
• Combine with structure analysis (HH/HL vs. LH/LL) and higher-timeframe S/R.
• Use standard time-based candles; avoid interpreting signals on Heikin Ashi, Renko, Kagi, Point & Figure, or Range charts.
Technical notes
• Built on locked higher-timeframe data (1W and 3W).
• Interpolation is used to render HTF structure smoothly on lower charts.
• Non-repainting: values finalize when the higher timeframe closes; lower-TF plotting is interpolated, not forward-looking.
Who it is for
• Traders who want a consistent, rules-based higher-timeframe bias filter.
• Systematic users who prefer fixed-parameter baselines for regime context.
Limitations & disclosures
• Closed-source; educational and analytical use only.
• Not financial advice. Markets involve risk; past performance does not guarantee future results.
Release notes
• Includes the 3-Week Trap Line (3W). It is hidden by default in the Style tab; enable it if you want an additional macro confirmation layer.
• Fixed-parameter design (no user-tweakable inputs) for consistent behavior across symbols.
• Non-repainting values finalize on 1W/3W candle close.
Originality & why closed-source
This is not a reimplementation of public open-source scripts. Trap Line uses a specific combination of higher-timeframe Hull smoothing, optional linear-regression pre-filtering, and lower-timeframe interpolation designed to expose trap zones (temporary regime breaches that often fail without a confirmed weekly close). The integration and thresholds are proprietary and tuned to retain weekly structure with reduced lag. The source is closed to protect this implementation.
Integration, not a mashup
Trap Line is a single, self-contained framework. It does not merely merge other indicators; its components are integrated to produce a unified higher-timeframe baseline (1W/3W) with a defined reading protocol (above/below line, weekly-close confirmation, optional candle-color confirmation).
Indicator, not a strategy
This publication provides an indicator overlay, not a trading strategy. It includes no backtests, position logic, performance claims, or risk assumptions. Use it as an analytical bias filter within your own risk management.
Comparison to common tools
Compared to standard MAs or SuperTrend-style bands, Trap Line prioritizes (1) higher-timeframe structure fidelity, (2) reduced lag via HMA-type smoothing, and (3) explicit weekly-close confirmation to avoid premature regime flips. The optional 3-Week line acts as a macro confirmation layer and is hidden by default in the Style tab.
Скрипт с защищённым кодом
Этот скрипт опубликован с закрытым исходным кодом. Однако вы можете использовать его свободно и без каких-либо ограничений — читайте подробнее здесь.
Отказ от ответственности
Информация и публикации не предназначены для предоставления и не являются финансовыми, инвестиционными, торговыми или другими видами советов или рекомендаций, предоставленных или одобренных TradingView. Подробнее читайте в Условиях использования.