PROTECTED SOURCE SCRIPT
Displacement Candle Detector
This indicator is designed to automatically identify displacement candles — large, momentum-driven candles that signal strong institutional order flow or the beginning of a market expansion.
It’s particularly useful for Step 3 of your 5-Step Model, where you wait for displacement after a liquidity sweep to confirm directional bias (Buy or Sell).
⚙️ How It Works
Calculates Candle Body Size:
Measures the absolute distance between a candle’s open and close (the real body).
Compares to Average Body (Lookback):
Uses a Simple Moving Average (SMA) of body sizes over the last n candles (default = 5).
This gives the script a baseline for what a “normal” candle looks like.
Defines a Displacement Candle:
When the current candle’s body size is ≥ 1.5× (or user-set multiplier) of the average body, it’s flagged as a displacement candle.
Distinguishes Bullish vs. Bearish Momentum:
Bullish displacement: Close > Open and candle body ≥ 1.5× average
Bearish displacement: Close < Open and candle body ≥ 1.5× average
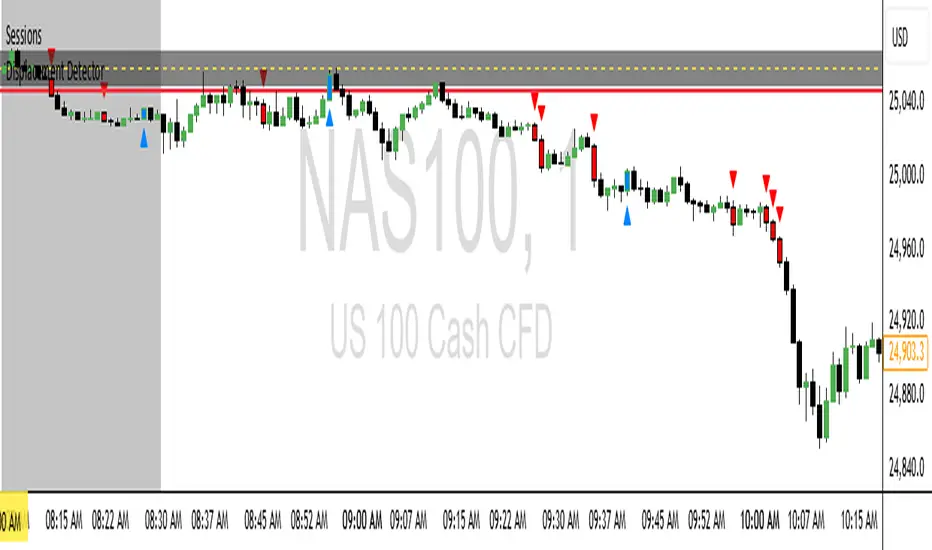
🖥️ What It Displays on Chart
Bar Colors:
Green = Bullish displacement
Red = Bearish displacement
Labels:
Appears above or below the candle (optional toggle).
Helps you easily spot where strong moves originated.
Shapes (Triangles):
Plots a small up/down triangle for each displacement event.
Useful for backtesting, alerts, or pairing with your MSS/FVG setups later.
🧩 Inputs
Setting Description Default
len Lookback period for average body calculation 5
mult Body size multiplier threshold 1.5
showLabels Toggle for displaying candle labels true
showColors Toggle for coloring displacement candles true
🧠 Trading Application
This script acts as your “momentum confirmation filter.”
In your 5-Step Model:
Step 1–2: Wait for liquidity sweep & directional bias.
Step 3: Use this indicator to confirm that displacement (real momentum) occurred.
Step 4–5: Drop to the lower timeframe for MSS confirmation and premium/discount entry.
Once a displacement candle prints, it suggests that:
The side of liquidity swept has been taken,
Institutions are committing volume in the opposite direction,
A Fair Value Gap (FVG) is likely forming for your entry zone.
💡 Pro Tips
Timeframes: Use it on 15m for confirmation, and 1–5m for entry precision.
Multiplier Tuning:
Use 1.3–1.6 for scalping (sensitive).
Use 1.8–2.0 for swing setups (stronger confirmation).
Combine With:
Smart Money Concepts (SMC) Lite for BOS/MSS
FVG Auto-Draw for entry zones
Session Range indicator to visualize liquidity sweeps before displacement.
It’s particularly useful for Step 3 of your 5-Step Model, where you wait for displacement after a liquidity sweep to confirm directional bias (Buy or Sell).
⚙️ How It Works
Calculates Candle Body Size:
Measures the absolute distance between a candle’s open and close (the real body).
Compares to Average Body (Lookback):
Uses a Simple Moving Average (SMA) of body sizes over the last n candles (default = 5).
This gives the script a baseline for what a “normal” candle looks like.
Defines a Displacement Candle:
When the current candle’s body size is ≥ 1.5× (or user-set multiplier) of the average body, it’s flagged as a displacement candle.
Distinguishes Bullish vs. Bearish Momentum:
Bullish displacement: Close > Open and candle body ≥ 1.5× average
Bearish displacement: Close < Open and candle body ≥ 1.5× average
🖥️ What It Displays on Chart
Bar Colors:
Green = Bullish displacement
Red = Bearish displacement
Labels:
Appears above or below the candle (optional toggle).
Helps you easily spot where strong moves originated.
Shapes (Triangles):
Plots a small up/down triangle for each displacement event.
Useful for backtesting, alerts, or pairing with your MSS/FVG setups later.
🧩 Inputs
Setting Description Default
len Lookback period for average body calculation 5
mult Body size multiplier threshold 1.5
showLabels Toggle for displaying candle labels true
showColors Toggle for coloring displacement candles true
🧠 Trading Application
This script acts as your “momentum confirmation filter.”
In your 5-Step Model:
Step 1–2: Wait for liquidity sweep & directional bias.
Step 3: Use this indicator to confirm that displacement (real momentum) occurred.
Step 4–5: Drop to the lower timeframe for MSS confirmation and premium/discount entry.
Once a displacement candle prints, it suggests that:
The side of liquidity swept has been taken,
Institutions are committing volume in the opposite direction,
A Fair Value Gap (FVG) is likely forming for your entry zone.
💡 Pro Tips
Timeframes: Use it on 15m for confirmation, and 1–5m for entry precision.
Multiplier Tuning:
Use 1.3–1.6 for scalping (sensitive).
Use 1.8–2.0 for swing setups (stronger confirmation).
Combine With:
Smart Money Concepts (SMC) Lite for BOS/MSS
FVG Auto-Draw for entry zones
Session Range indicator to visualize liquidity sweeps before displacement.
Скрипт с защищённым кодом
Этот скрипт опубликован с закрытым исходным кодом. Однако вы можете использовать его свободно и без каких-либо ограничений — читайте подробнее здесь.
Отказ от ответственности
Все виды контента, которые вы можете увидеть на TradingView, не являются финансовыми, инвестиционными, торговыми или любыми другими рекомендациями. Мы не предоставляем советы по покупке и продаже активов. Подробнее — в Условиях использования TradingView.