OPEN-SOURCE SCRIPT
Bitcoin Stalemate Indicator
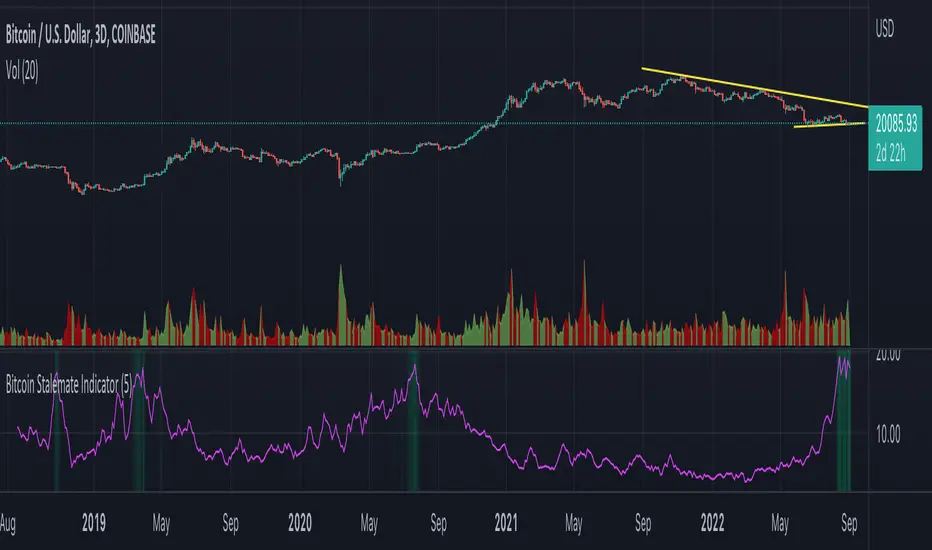
The Bitcoin Stalemate Indicator examines periods in the market defined by a combination of high volume and low price volatility. These periods are a bit like a tug-of-war with both sides applying a lot of force but the rope moving very little. Periods of high volume and low volatility suggest both sides of the trade are stuck in a stalemate. This indicator may be useful in identifying psychologically important price levels.
The mechanics of the indicator are fairly simple: the indicator takes the volume and divides it by the candle’s size over it’s close for that same period.
volume / ((high - low) / close)
Candles that move very little but with high volume will produce higher reads and vice versa. Finally a smoothing average is applied to clean up the noise.
Volume profiles from the top 6 exchanges are averaged in order to avoid a single exchange’s popularity acting as an overriding factor. Single exchanges can be isolated but are of lesser use. Heat map functionality is only active when all exchanges are selected.
Скрипт с открытым кодом
В истинном духе TradingView, создатель этого скрипта сделал его открытым исходным кодом, чтобы трейдеры могли проверить и убедиться в его функциональности. Браво автору! Вы можете использовать его бесплатно, но помните, что перепубликация кода подчиняется нашим Правилам поведения.
Отказ от ответственности
Информация и публикации не предназначены для предоставления и не являются финансовыми, инвестиционными, торговыми или другими видами советов или рекомендаций, предоставленных или одобренных TradingView. Подробнее читайте в Условиях использования.