OPEN-SOURCE SCRIPT
Обновлено [OBV] [MACD] [Accelerator/Awesome Oscillator] + PivDiv 2
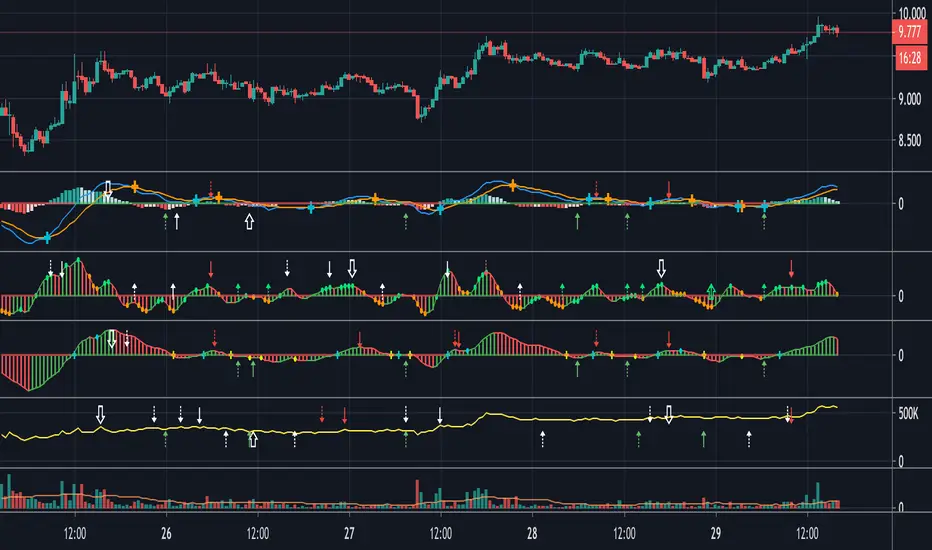
Here is an indicator with 4 options:
- OBV [On Balance Volume]
- MACD [MACD] (uses default EMA, you can change this to SMA)
- AC [Accelerator Oscillator]
- AO [Awesome Oscillator]
All accompanied with my "Divergences (Pivots)" with 3 settings:
- 'Long Period', default checks 19 bars to the Left (="History") and 1 bar to the Right (="Future")
- 'Medium Period', default checks 14 bars to the Left (="History") and 1 bar to the Right (="Future")
- 'Short Period', default checks 9 bars to the Left (="History") and 1 bar to the Right (="Future")
When choosing an indicator, it comes with their accompanying "Divergences"!
Each Bar checks an amount of Bars at the Left (="History") and Bars to the Right (="Future"), insuring this particular Bar is the Highest or Lowest of them all at "close",
this is compared to the [On Balance Volume] or [MACD] or [Accelerator or Awesome Oscillator] and so we have our Divergences.
There is always a slight delay (number of Bar(s) at the Right side (="Future")
If you like a setting, where the amount of “RightBars” equals the ”LeftBars” you can enable the " > Only change 'LeftBars'" button.
Then you only have to adjust the amount of “LeftBars” and the amount of “RightBars” automatically will be the same.
Bullish divergences are "Green"
- 'Short' - 'Medium' "period" > "▲"
- 'Long' "period" > "⇧"
Bearish divergences are "Red"
- 'Short' - 'Medium' "period" > "▼"
- 'Long' "period" > "⇩"
Hidden divergences ( Bullish and Bearish ) are:
- 'Short' - 'Medium' "period" > "▲▼" - "White"
- 'Long' "period" > "⬆︎⬇︎" - "Yellow"
Since for me, at this moment, it is impossible to let this indicator work as our eyes work, it will miss sometimes. I've tried to solve this by putting 3 different "Periods",
but it is not perfect, so look at it as an aiding tool, a "hint" so you can look in detail if there is something of importance or not.
What also helps is to switch timeframes.
For example on a 1 hour chart a "Highest" point can be missed sometimes, but could be perfectly visible on a 2 or 4 hour chart.
Also, try to change the numbers in a way that suits you the best.
Enjoy!
Информация о релизе
Added an extra plot line to the "Accelerator/Deceleration Oscillator" and the "Awesome Oscillator" for better interpretation,this line also changes colour according to the Histogram.
The 0-line in "MACD", "Accelerator/Deceleration Oscillator" and the "Awesome Oscillator" changes colour as well according if the movement is above or below the 0-line
Also added green & orange dots in the "Accelerator/Deceleration Oscillator" and the "Awesome Oscillator"
Dots "Awesome Oscillator":
"Saucer" (3 bars signal) is:
a buy signal when the bars are above the 0-line and:
- second column is falling lower than the first one (red coloured)
- third column is rising higher than the second (green coloured)
a sell signal when the bars are below the 0-line and:
- second column is rising higher than the first one (green coloured)
- third column is falling lower than the second (red coloured)
"Zero line crossing" (2 bars signal):
- when the bars crosses the 0-line
Dots "Accelerator/Deceleration Oscillator":
DON'T buy when the current column is red,
DON'T sell when the current column is green.
If Acceleration/Deceleration is above the 0-line, then it is usually easier for the acceleration to continue the upward movement (and vice versa in cases when it is below the 0-line).
Unlike with the "Awesome Oscillator", when the 0-line is crossed, this is not a signal. The only thing what matters for making decisions is detecting colour changes.
Buy signal (2 bars signal):
- when the indicator is above the 0-line > 2 consecutive green columns
Buy signal (3 bars signal):
- when the indicator is below the 0-line > 3 consecutive green columns
Sell signal (2 bars signal):
- when the indicator is below the 0-line > 2 consecutive red columns
Sell signal (3 bars signal):
- when the indicator is above the 0-line > 3 consecutive red columns
Информация о релизе
Added "Sensitivity" of "Divergences": if [X] ⩾2 then the value is compared with ⩾2 previous values, making the sensitivity higher(default setting = 3, if you like previous setting, just change to "1")
Example:
"Sensitivity" [1]
"Sensitivity" [2]
"Sensitivity" [3]
"Sensitivity" [4]
"Sensitivity" [6]
You'll see the higher the "Sensitivity", less Divergences get missed, of course there are also more symbols,
I wouldn't suggest to use a "Sensitivity" higher than "6"
Have fun!
Информация о релизе
Previous examples should be accompanied with numbers, they disappeared because I used '['The examples were with "Sensitivity" of 1, 2, 3, 4 and lastly 6
I've now was able to fix the needless recurring symbols, I now set the "Sensitivity" at 5, you can always change it of course.
While evaluating be sure to check different timeframes as well!
Also, some small changes:
Bullish divergences are still "Green"
- "⇡︎" = 'Short' "period"
- "↑" = 'Medium' "period"
- "⇧" = 'Long' "period"
Bearish divergences are still "Red"
- "⇣︎" = 'Short' "period"
- "↓︎" = 'Medium' "period"
- "⇩︎" = 'Long' "period"
Hidden Bullish divergences are "White"
- "⇡︎" = 'Short' "period"
- "↑" = 'Medium' "period"
- "⇧" = 'Long' "period"
Hidden Bearish divergences are "White"
- "⇣︎" = 'Short' "period"
- "↓︎" = 'Medium' "period"
- "⇩︎" = 'Long' "period"
Thank you!
Скрипт с открытым кодом
В истинном духе TradingView, создатель этого скрипта сделал его открытым исходным кодом, чтобы трейдеры могли проверить и убедиться в его функциональности. Браво автору! Вы можете использовать его бесплатно, но помните, что перепубликация кода подчиняется нашим Правилам поведения.
Who are PineCoders?
tradingview.com/chart/SSP/yW5eOqtm-Who-are-PineCoders/
TG Pine Script® Q&A: t.me/PineCodersQA
- We cannot control our emotions,
but we can control our keyboard -
tradingview.com/chart/SSP/yW5eOqtm-Who-are-PineCoders/
TG Pine Script® Q&A: t.me/PineCodersQA
- We cannot control our emotions,
but we can control our keyboard -
Отказ от ответственности
Информация и публикации не предназначены для предоставления и не являются финансовыми, инвестиционными, торговыми или другими видами советов или рекомендаций, предоставленных или одобренных TradingView. Подробнее читайте в Условиях использования.