PROTECTED SOURCE SCRIPT
Z_TRend

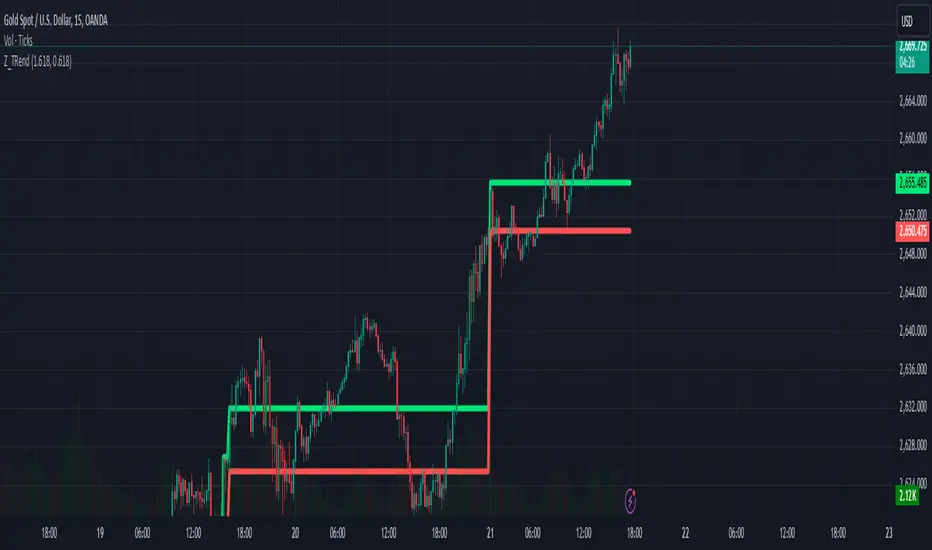
The Z_Trend indicator is designed to detect significant volume spikes during trading sessions and identify the high/low levels of the candlestick with the highest volume in each session. This helps users recognize key price zones and monitor market activity effectively.
Main Features:
Session Classification:
Asian Session: From 0:00 to 14:00 (UTC+7).
European Session: From 14:00 to 19:00 (UTC+7).
US Session: From 19:00 to 23:00 (UTC+7).
Volume Analysis:
Calculates a Simple Moving Average (SMA) of the volume over the last 89 candles.
Marks candles with volumes exceeding defined thresholds:
High Threshold: Default is 1.618 (adjustable).
Low Threshold: Default is 0.618 (adjustable).
Highlighting Highest Volume Candle:
Detects the candle with the highest volume in each session.
Plots the high and low levels of this candle on the chart to signify critical price zones.
Volume-Based Candle Coloring:
Bullish candles (closing above open) with high volume are marked green.
Bearish candles (closing below open) with high volume are marked dark red.
Customizable Inputs:
High Threshold: Set to 1.618 by default; can be adjusted.
Low Threshold: Set to 0.618 by default; can be adjusted.
Chart Visuals:
Green line: Represents the highest price of the candle with the largest volume in the session.
Red line: Represents the lowest price of the candle with the largest volume in the session.
Practical Applications:
Identify Key Price Zones: Use the high/low levels of the high-volume candle to locate potential support/resistance levels.
Analyze Market Dynamics: Observe candle colors and volume to gauge session-specific trends.
Trading Strategy: Utilize these insights to make informed entry and exit decisions.
Notes:
The indicator can be adjusted to fit individual trading strategies.
It is recommended to combine this tool with other indicators for more reliable signals.
Try it out on your chart now to discover potential trading opportunities! 🚀
Скрипт с защищённым кодом
Этот скрипт опубликован с закрытым исходным кодом. Однако вы можете использовать его свободно и без каких-либо ограничений — читайте подробнее здесь.
Отказ от ответственности
Информация и публикации не предназначены для предоставления и не являются финансовыми, инвестиционными, торговыми или другими видами советов или рекомендаций, предоставленных или одобренных TradingView. Подробнее читайте в Условиях использования.