OPEN-SOURCE SCRIPT
SA 2.0
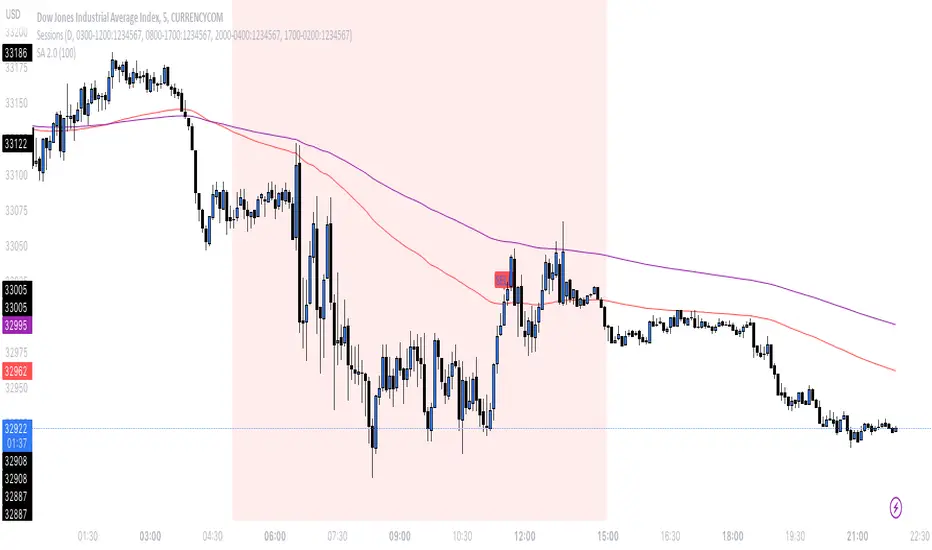
The 100/200 EMA crossover strategy is a popular trend-following strategy used in technical analysis. It aims to identify potential buy and sell signals based on the crossover of two exponential moving averages (EMAs), specifically the 100-period EMA and the 200-period EMA. This strategy is designed to capture the momentum of the market and take advantage of sustained trends in the price of US30. This strategy can also work on other instruments, just backtest the winrate.
How it Works:
Timeframe Selection: The strategy is optimized for the US30 index and is implemented on both the 5-minute and 3-minute charts. These shorter timeframes provide more frequent trading opportunities and allow for quicker decision-making.
EMA Crossover: The strategy focuses on the crossover of the 100-period EMA and the 200-period EMA. When the 100 EMA crosses above the 200 EMA, it generates a bullish signal, indicating a potential upward trend. Conversely, when the 100 EMA crosses below the 200 EMA, it generates a bearish signal, suggesting a potential downward trend.
Rejection Confirmation: To filter out false signals and increase the reliability of the strategy, it incorporates a rejection confirmation. After the initial crossover, the strategy looks for price rejections near the 100 EMA. A rejection occurs when the price briefly moves below the 100 EMA and then quickly bounces back above it, indicating potential support and a possible continuation of the trend. It is during this rejection that the strategy generates the buy or sell signal.
Buy and Sell Signals: When a rejection occurs after the crossover, the strategy generates a buy signal if the rejection is above the 100 EMA. This suggests that the price is likely to continue its upward momentum. On the other hand, a sell signal is generated if the rejection occurs below the 100 EMA, indicating a potential continuation of the downward trend. These signals help traders identify favorable entry points for long or short positions.
Risk Management: As with any trading strategy, proper risk management is crucial. Traders can use stop-loss orders to limit potential losses in case the market moves against their positions. Additionally, setting profit targets or trailing stops can help secure profits as the trend progresses.
It's important to note that no trading strategy guarantees success, and it's recommended to test the strategy on historical data or in a demo trading environment before applying it with real funds. Furthermore, regular monitoring and adjustment may be necessary to adapt to changing market conditions.
Disclaimer: This description is for informational purposes only and should not be considered as financial advice. Trading carries risks, and individuals should exercise caution and consult with a qualified financial professional before making any investment decisions.
Скрипт с открытым кодом
В истинном духе TradingView, создатель этого скрипта сделал его открытым исходным кодом, чтобы трейдеры могли проверить и убедиться в его функциональности. Браво автору! Вы можете использовать его бесплатно, но помните, что перепубликация кода подчиняется нашим Правилам поведения.
Отказ от ответственности
Информация и публикации не предназначены для предоставления и не являются финансовыми, инвестиционными, торговыми или другими видами советов или рекомендаций, предоставленных или одобренных TradingView. Подробнее читайте в Условиях использования.