OPEN-SOURCE SCRIPT
Обновлено RSI Moving Average Crossovers

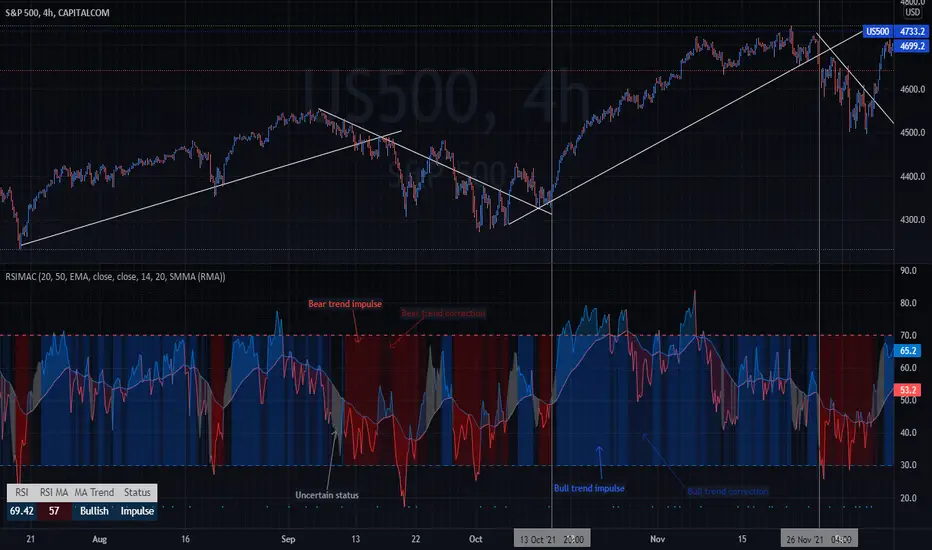
This script is an improved version of the RSI indicator, using a moving average on the RSI itself, as well as two other moving averages used to determine the current trend.
A small screener indicating the current movement is displayed in the bottom-left zone of the chart: trend (Bullish/Bearish/Uncertain) and status (Impulse or Correction)
Trends are simply based on moving averages crossovers, coupled to the fact that the current candle closes above the fast MA in a bull trend, and under the fast MA in a bear trend. In other cases, the trend and the movement are considered as "Uncertain" by the indicator.
Options
Defaults Parameters
Don't hesitate to suggest any idea which could improve this indicator.
A small screener indicating the current movement is displayed in the bottom-left zone of the chart: trend (Bullish/Bearish/Uncertain) and status (Impulse or Correction)
Trends are simply based on moving averages crossovers, coupled to the fact that the current candle closes above the fast MA in a bull trend, and under the fast MA in a bear trend. In other cases, the trend and the movement are considered as "Uncertain" by the indicator.
Options
- Various types of moving averages for the RSI and trend MA
- Show/Hide crossovers between the RSI and its MA
- Color the RSI normal zone with the current trend/movement colors
- Show/Hide the screener indicating the current movement
Defaults Parameters
- Fast MA 20
- Slow MA 50
- MA source: Close
- RSI Length 14
- RSI MA: SMMA (RMA)
- RSI MA Length: 20
Don't hesitate to suggest any idea which could improve this indicator.
Информация о релизе
Updates- Trend moving average crossovers are now displayed as xcrosses on the indicator (can be disabled)
- Overbought and oversold levels can be modified in options
Информация о релизе
moving average crosses title modified Информация о релизе
50% line addedСкрипт с открытым кодом
В истинном духе TradingView, создатель этого скрипта сделал его открытым исходным кодом, чтобы трейдеры могли проверить и убедиться в его функциональности. Браво автору! Вы можете использовать его бесплатно, но помните, что перепубликация кода подчиняется нашим Правилам поведения.
Отказ от ответственности
Информация и публикации не предназначены для предоставления и не являются финансовыми, инвестиционными, торговыми или другими видами советов или рекомендаций, предоставленных или одобренных TradingView. Подробнее читайте в Условиях использования.
Скрипт с открытым кодом
В истинном духе TradingView, создатель этого скрипта сделал его открытым исходным кодом, чтобы трейдеры могли проверить и убедиться в его функциональности. Браво автору! Вы можете использовать его бесплатно, но помните, что перепубликация кода подчиняется нашим Правилам поведения.
Отказ от ответственности
Информация и публикации не предназначены для предоставления и не являются финансовыми, инвестиционными, торговыми или другими видами советов или рекомендаций, предоставленных или одобренных TradingView. Подробнее читайте в Условиях использования.