OPEN-SOURCE SCRIPT
Kalman Supertrend (High vs Low) Bands by Skyito V2
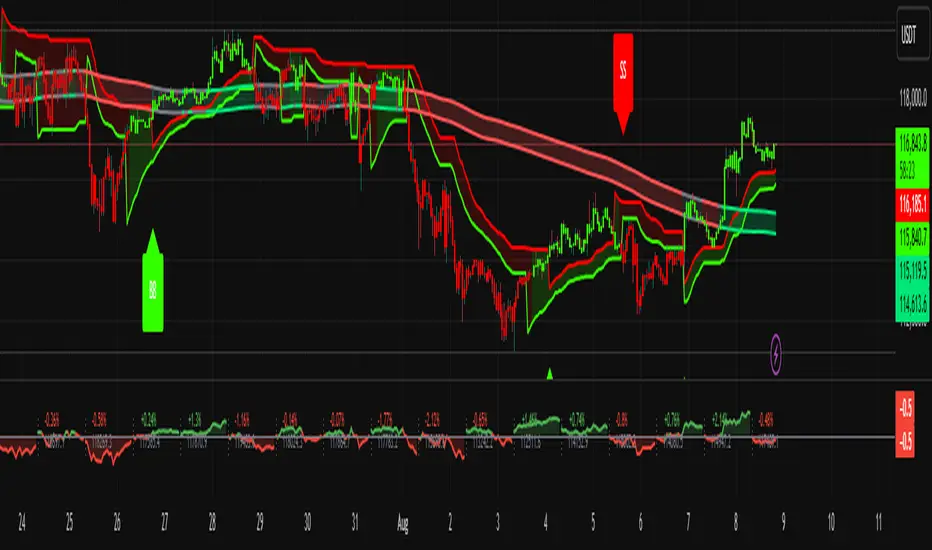
Inspired by BackQuant's Kalman Hull Supertrend, this upgraded version replaces the typical Kalman-close method with Kalman-filtered High and Low sources. This approach provides clearer trend visualization and helps confirm potential breakouts or reversals using clean, directional candle signals.
The core logic revolves around BB (Band Buy) and SS (Band Sell) signals:
BB appears only when a candle fully breaks above both Kalman High and Low bands.
SS appears when a candle fully breaks below both bands.
These clean triggers help avoid false signals and are excellent for capturing high-probability trend shifts.
✅ The Supertrend line is also included and can be toggled on or off — useful for those who prefer early trend detection or confirmation.
🆕 Why the SMA Band was Included
To complement the Kalman band system, a Moving Average Band (default: SMA 200) is added:
It helps detect the long-term trend direction.
Candles are colored green when above the SMA band and red when below.
This visual cue strengthens trend confidence and adds an extra layer for filtering trades.
The MA band and coloring can be turned on or off based on preference.
This tool is built for traders who want a clean trend-following and breakout confirmation system. It can be used as a standalone strategy or paired with price action, volume, or support/resistance tools.
Скрипт с открытым кодом
В истинном духе TradingView, создатель этого скрипта сделал его открытым исходным кодом, чтобы трейдеры могли проверить и убедиться в его функциональности. Браво автору! Вы можете использовать его бесплатно, но помните, что перепубликация кода подчиняется нашим Правилам поведения.
Отказ от ответственности
Информация и публикации не предназначены для предоставления и не являются финансовыми, инвестиционными, торговыми или другими видами советов или рекомендаций, предоставленных или одобренных TradingView. Подробнее читайте в Условиях использования.