OPEN-SOURCE SCRIPT
Обновлено Customizable Vertical Lines

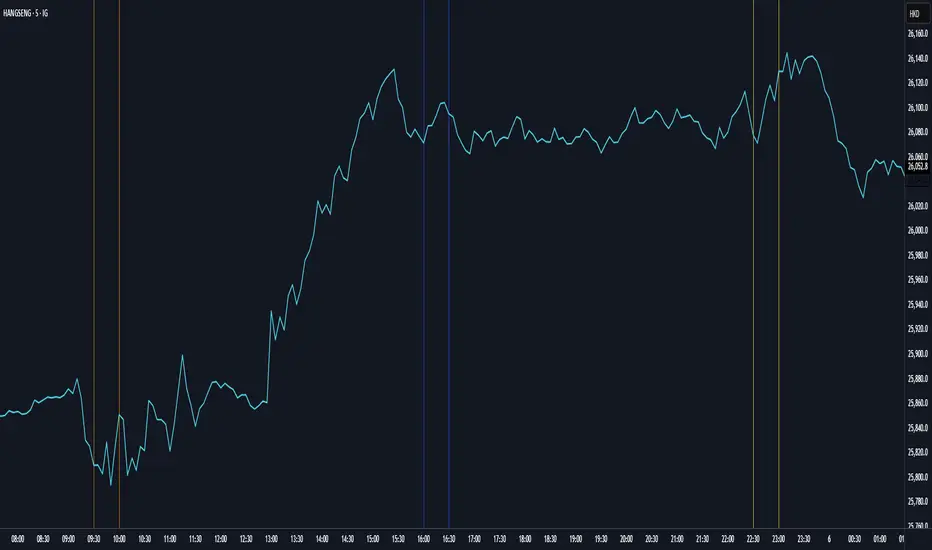
Customizable Vertical Lines (CVL) Indicator
Version 2.0 (November 2023)
Description:
The Customizable Vertical Lines (CVL) indicator is a powerful tool for traders who want to mark specific times on their charts with vertical lines. This indicator allows users to customize the appearance of these lines, including their color, line style, and width, providing a flexible and visually intuitive way to highlight key time points.
Key Features:
User-Friendly Inputs: Easily set up to five distinct times, each associated with a unique color for the vertical lines.
Color Customization: Choose from a wide range of colors for each vertical line, allowing for clear differentiation.
Line Style Options: Tailor the appearance of the lines with three selectable styles: solid, dotted, or dashed.
Adjustable Line Width: Modify the thickness of the lines to suit your preferred visual style.
Timezone Offset: Account for different time zones by adjusting the timezone offset parameter.
How to Use:
Simply input the desired times, colors, and other parameters in the script settings. The CVL indicator will then automatically plot vertical lines at the specified times on the chart with the chosen customization.
Информация о релизе
Customizable Vertical Lines (CVL) Indicator: Advanced Time MarkingThe Customizable Vertical Lines (CVL) indicator is a powerful tool for marking specific times on your charts, now featuring enhanced labeling to make your time-based analysis permanent and clean.
Информация о релизе
Added minutes optionИнформация о релизе
Added MinutesСкрипт с открытым кодом
В истинном духе TradingView, создатель этого скрипта сделал его открытым исходным кодом, чтобы трейдеры могли проверить и убедиться в его функциональности. Браво автору! Вы можете использовать его бесплатно, но помните, что перепубликация кода подчиняется нашим Правилам поведения.
Отказ от ответственности
Информация и публикации не предназначены для предоставления и не являются финансовыми, инвестиционными, торговыми или другими видами советов или рекомендаций, предоставленных или одобренных TradingView. Подробнее читайте в Условиях использования.
Скрипт с открытым кодом
В истинном духе TradingView, создатель этого скрипта сделал его открытым исходным кодом, чтобы трейдеры могли проверить и убедиться в его функциональности. Браво автору! Вы можете использовать его бесплатно, но помните, что перепубликация кода подчиняется нашим Правилам поведения.
Отказ от ответственности
Информация и публикации не предназначены для предоставления и не являются финансовыми, инвестиционными, торговыми или другими видами советов или рекомендаций, предоставленных или одобренных TradingView. Подробнее читайте в Условиях использования.