OPEN-SOURCE SCRIPT
Gradiente
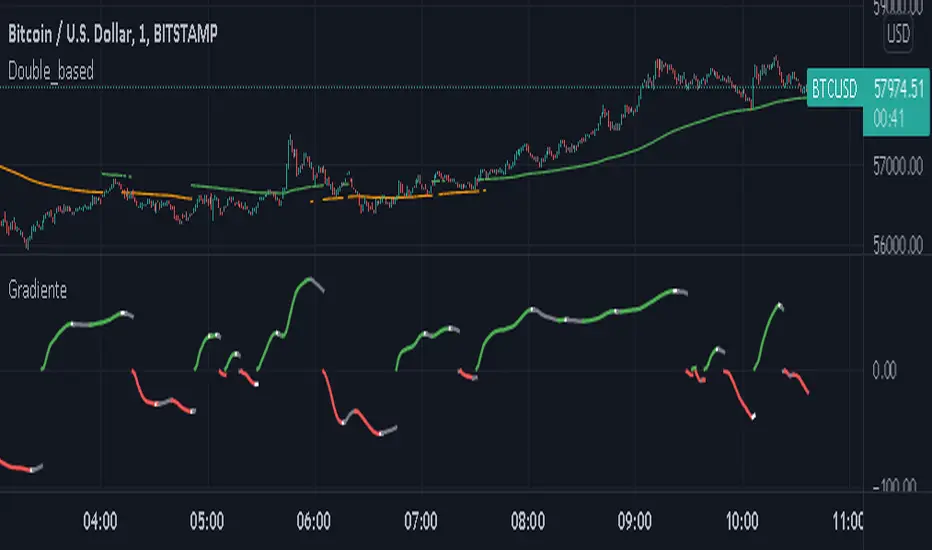
This indicator works in following concep. In a trend the area between two EMA increases as the trend go forward. When the trend loose strenth the fast EMA is the first to slow down and the area betwenn the EMA stop to increase indicating a lost of momentum.
The gradient is the division of the area formed between the EMA by the number of bars it contains.
In a up-trend is above 0.
In a down-trend is below 0.
The color green in the up trend shows the strenth is on, the white color shows the momentum is weaking.
The color red in the down trend shows the strenth is on, the white color shows the momentum is weaking.
Is necessary to plot the same EMA periods on the chart price to compare the strenth.
Скрипт с открытым кодом
В истинном духе TradingView, создатель этого скрипта сделал его открытым исходным кодом, чтобы трейдеры могли проверить и убедиться в его функциональности. Браво автору! Вы можете использовать его бесплатно, но помните, что перепубликация кода подчиняется нашим Правилам поведения.
Отказ от ответственности
Информация и публикации не предназначены для предоставления и не являются финансовыми, инвестиционными, торговыми или другими видами советов или рекомендаций, предоставленных или одобренных TradingView. Подробнее читайте в Условиях использования.